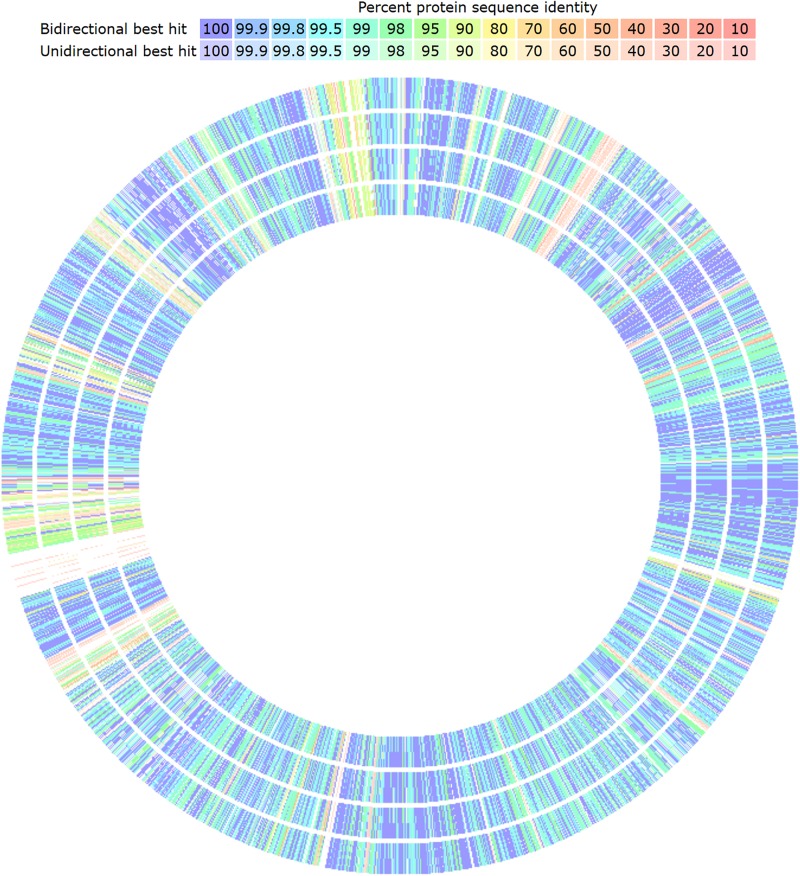
FIGURE 5.
Graphical genomic comparison map of L. plantarum strains with Seed Viewer sequenced-based comparison tool in RAST server. L. plantarum CECT 8962 was taken as reference (not shown). From outer to inner ring: strain CECT 8965, CECT 8963, CECT 8964, and 8966. Colors denote amino acid similarity percentage to the reference genome, from purple (100%) to light red (10%).

