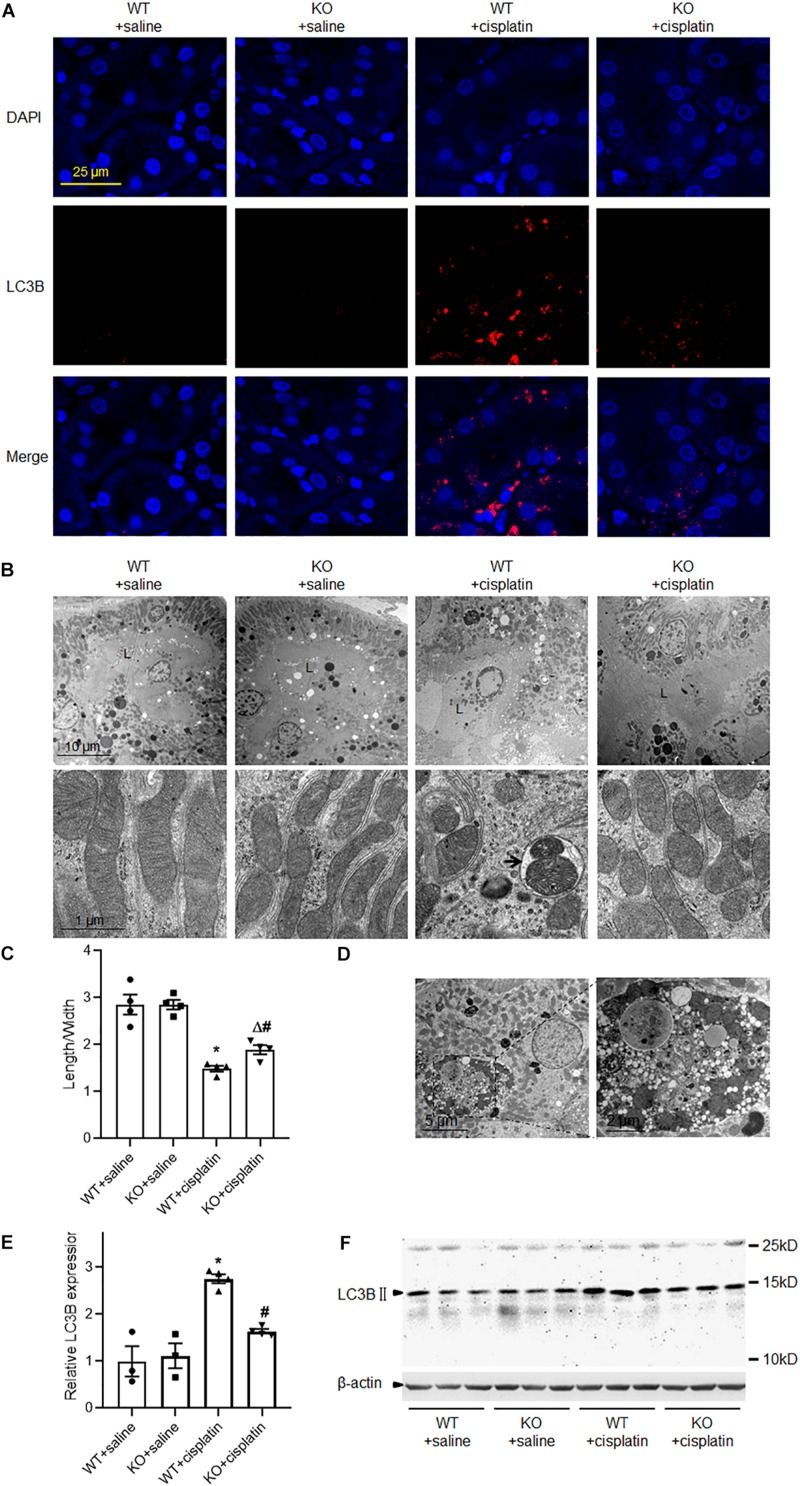
FIGURE 2.
PINK1 deficiency prevented cisplatin-induced mitophagy. (A) Representative images of LC3B immunostaining. (B) Representative transmission electron microscope images of renal proximal tubular cells and mitochondria. L indicated the proximal tubular lumen. The arrow indicated a representative mitophagosome. (C) Quantitative analysis of the length/width of mitochondria in proximal tubular cells. (D) Transmission electron microscope images of large vacuoles containing numerous autophagosomes and mitophagosomes in cisplatin treated WT rats. (E) Quantitative analysis of the western blotting of LC3BII. (F) Representative western blot bands of LC3BII in renal cortex. N = 3 in WT + saline group and KO + saline group, N = 4 in WT + cisplatin group and KO + cisplatin group. ∗P < 0.05, WT + cisplatin vs. WT + saline; #P < 0.05, KO + cisplatin vs. WT + cisplatin; ΔP < 0.05, KO + cisplatin vs. KO + saline. Data are mean ± SE.

