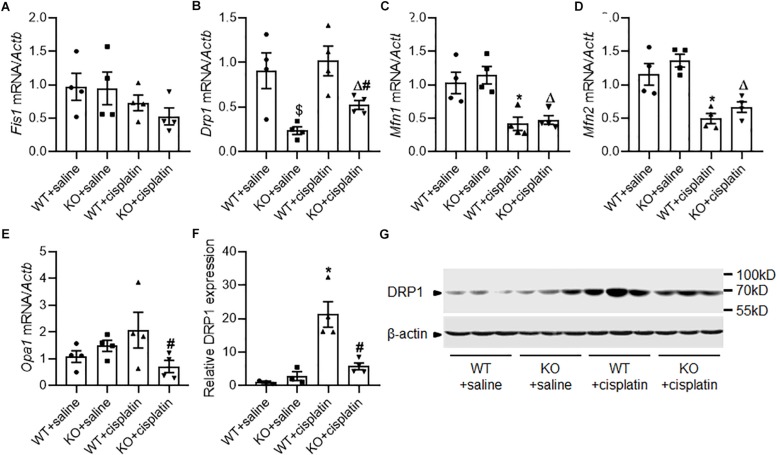
FIGURE 4.
The effect of PINK1 deficiency on mitochondrial dynamics related proteins during cisplatin treatment. (A–E) Real-time quantitative PCR analysis of Fis1, Drp1, Mfn1, Mfn2, and Opa1 mRNA expression in renal cortex. (F) Quantitative analysis of the western blotting of DRP1. (G) Representative western blot bands of DRP1 in renal cortex. N = 3 in WT + saline group and KO + saline group, N = 4 in WT + cisplatin group and KO + cisplatin group. ∗P < 0.05, WT + cisplatin vs. WT + saline; #P < 0.05, KO + cisplatin vs. WT + cisplatin; ΔP < 0.05, KO + cisplatin vs. KO + saline; $P < 0.05, KO + saline vs. WT + saline. Data are mean ± SE.

