Fig. 2.
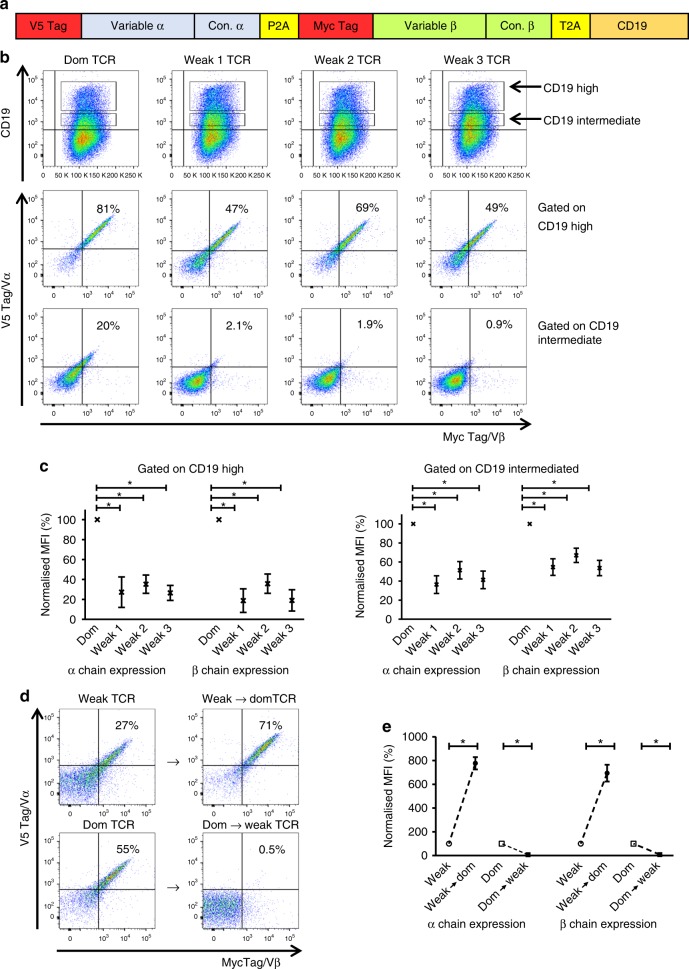
Conversion of a weak TCR into a dominant TCR by replacement of 14 variable region framework residues. a Schematic representation of the retroviral vector used for TCR expression studies. TCR α and β chain expression was determined using antibodies specific for the V5 and myc epitopes, respectively. Transduction efficiency was determined using antibodies specific for murine CD19. b Representative example of n = 4 independent experiments showing human Jurkat cells (expressing an endogenous TCR) transduced with a dominant (Dom) TCR (TRAV38-2/TRBV7-8) or three different weak TCRs: weak 1 (TRAV13-2/TRBV7-3), weak 2 (TRAV23/TRBV7-9) or weak 3 TCR (TRAV29/TRBV2). Top panel: CD19 expression levels. Middle panel: TCR α and β chain expression levels on gated CD19high cells. Bottom panel: TCR α and β chain expression levels on gated CD19intermediate cells. c Pooled data (means ± SEM) showing TCR α and β chain expression levels normalized to the Dom TCR. n = 4 independent experiments. Top panel: gated on CD19high cells. Bottom panel: gated on CD19intermediate cells. * P < 0.05 (Mann–Whitney U test) for all comparisons between the Dom TCR α chain and the weak TCR α chains and for all comparisons between the Dom TCR β chain and the weak TCR β chains. MFI, median fluorescence intensity. d Top panel: introduction of the 14 residues indicated in Fig. 1e into the weak 1 TCR (TRAV13-2/TRBV7-3) generated the weak → dom TCR with enhanced α/β expression on the cell surface. Bottom panel: replacement of the 14 residues in the Dom TCR (TRAV38-2/TRBV7-8) with the equivalent residues in the weak 1 TCR (TRAV13-2/TRBV7-3) generated the dom → weak TCR with undetectable α/β expression on the cell surface. TCR constructs were transduced into Jurkat cells expressing an endogenous TCR. Data are representative of four independent experiments. e Pooled data (means ± SEM) showing TCR α and β chain expression levels normalized to the corresponding unmodified TCRs. n = 4 independent experiments. *P < 0.05 (Mann–Whitney U test) for all comparisons between the modified TCRs and the corresponding unmodified TCRs. MFI median fluorescence intensity. Vα variable alpha, Vβ variable beta

