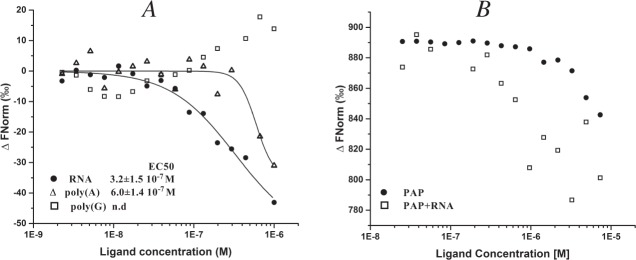
Figure 4.
Ligand binding to HfqH6. Binding curves are derived from the specific change in the thermophoretic mobility upon ligand titration to a constant 100 nM concentration of HfqH6. (A) The curves show binding affinities of HfqH6 for poly(G) (open squares), poly(A) (open triangles) or RNA (filled circles). For determination of the EC50, the Hill Model was used that is included in the NT Affinity Analysis software. (B) The curves show the binding of PAP to HfqH6 in the presence (open squares) or in the absence of RNA (filled circles). Total RNA (heterologous in size and form), poly(A) and poly(G) were used with 1 kb as a crude approximation for calculation. Thereby, if we consider a 50–100 nt RNA long, the binding constants return the range typically reported for Hfq.

