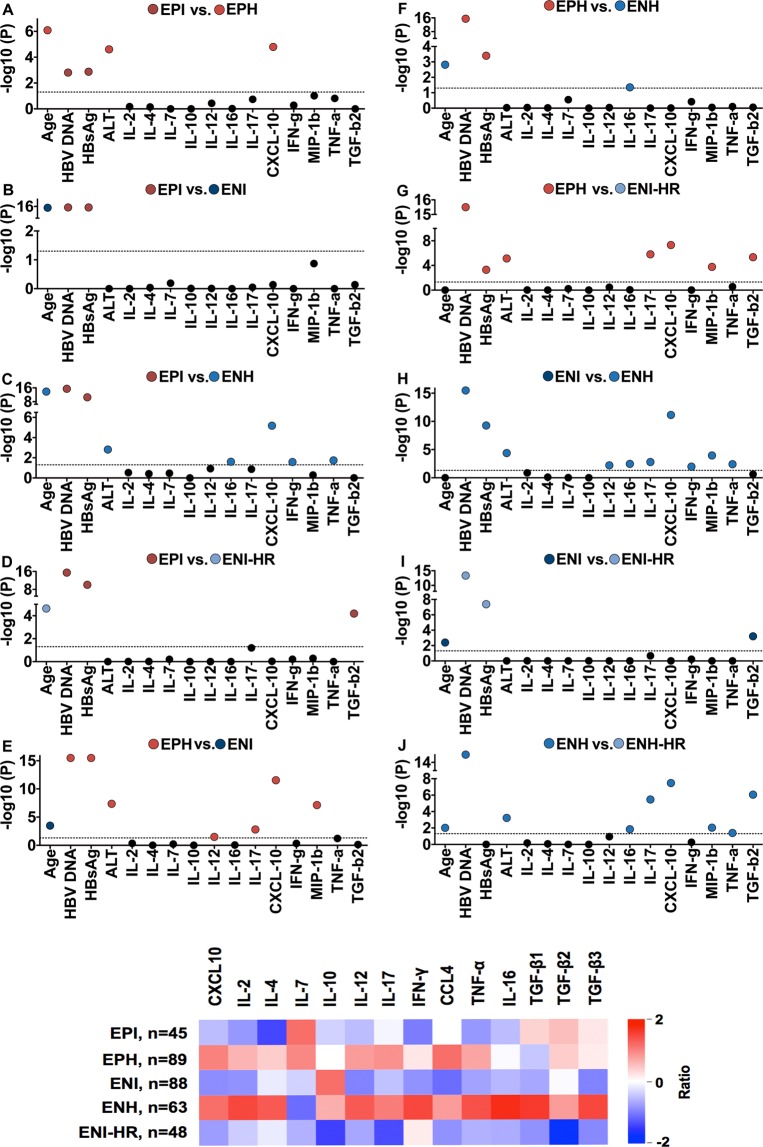
Figure 2.
SIM in phases of chronic HBV. (A) Significance evaluation of different virological, biochemical and immunological markers between phases of chronic HBV infection. The broken line indicates the significance threshold. Nonsignificant differences are marked with black dots. Significant differences are marked with a colored dot. Colored dots according to group color connotes significantly higher values of the parameter in this group compared to the other group. (B) Heat map showing the expression pattern of 14 soluble immune markers normalized by setting mean = 1 and variance = 0. The elements are colored according to the value of each SIM for each phase.

