Figure 1.
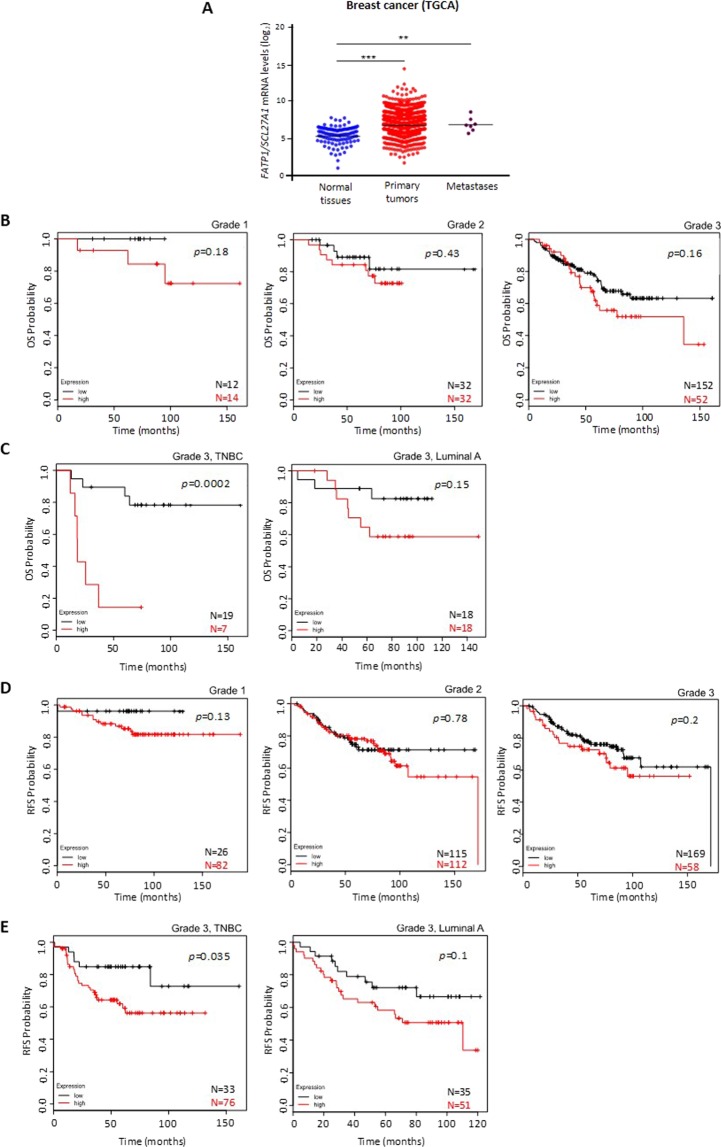
Patients with higher levels of FATP1/SLC27A1 expression have a lower OS and RFS. (A) Analysis of FATP1/SLC27A1 expression profiles in normal breast tissue, primary carcinomas and metastasis, data extracted from the TCGA database. A two-tailed unpaired Student’s t-test with Welch’s correction was used. Comparison of the overall survival (OS) and relapse free survival (RFS) curves of GEO database patients with high levels of FATP1 (red line) and low levels of FATP1 (black line) expression using Kaplan-Meier method. (B) Kaplan-Meier survival curves for patients with BC grade 1 (n = 26), grade 2 (n = 64) and grade 3 (n = 204). (C) Kaplan-Meier survival curves for patients with grade 3, TNBC BC (n = 26) and grade 3, luminal A BC (n = 36). (D) Kaplan-Meier RFS curves for patients with BC grade 1 (n = 108), grade 2 (n = 227) and grade 3 (n = 227). (E) Kaplan-Meier survival curves for patients with grade 3, TNBC BC (n = 108) and grade 3, luminal A BC (n = 86).

