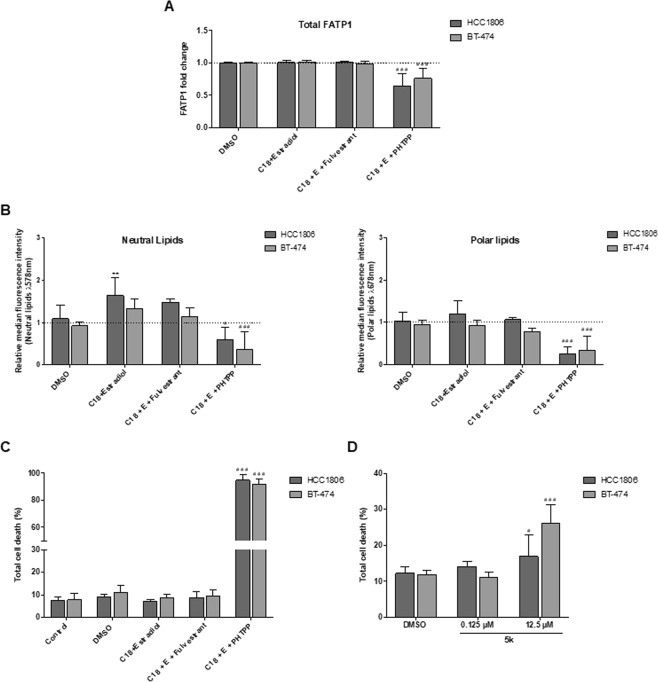
Figure 7.
ER-β signaling regulates the expression of FATP1 and FA uptake in BT-474 and HCC1806 cells. BT-474 and HCC1806 cells were cultured in control, control DMSO, estradiol and C18 conditions, in the presence or absence of Fulvestrant and PHTPP (A–C). Cells were also exposed to arylpiperazine 5k and compared to control DMSO (D). Total FATP1/SLC27A1 expression was analyzed by flow cytometry (a). Nile red labelling was analyzed to evaluate the accumulation of neutral (λ 578 nm) and polar (λ 678 nm) lipids by flow cytometry (B). Cell death assay was performed with flow cytometry using Annexin V and PI (C,D). Values are referenced to control/DMSO conditions within each cell line. Results are shown as mean ± SD. *p < 0.05, **p < 0.01, ***p < 0.001. (*) represents the statistical analysis in relation to control condition and (#) represents the statistical analysis in relation to DMSO condition. Biological triplicates were tested, only adherent cells were analyzed and dead cells in culture media were discarded; except in cell death analysis in which adherent and dead cells were analyzed together. Multiple comparisons were performed using One-way ANOVA with Dunnett’s or Tukey’s test.

