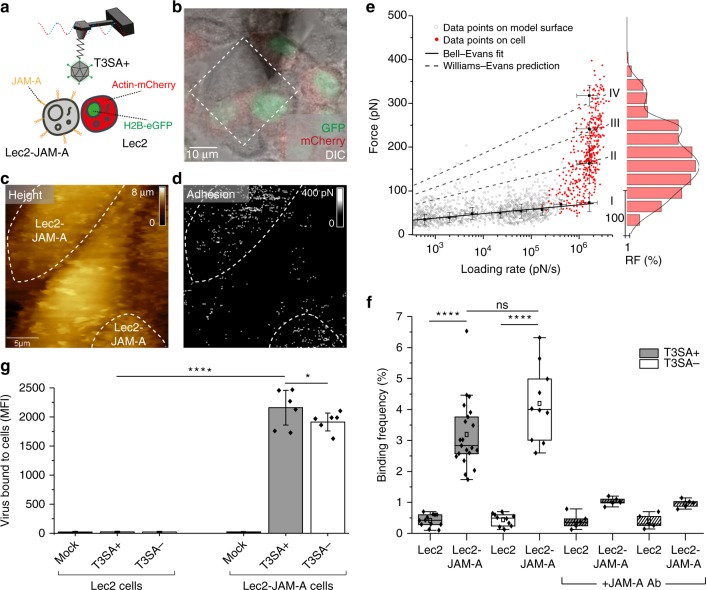
Fig. 5.
Probing reovirus binding to JAM-A on living cells. a Combined optical microscopy and FD-based AFM of T3SA+ interaction with JAM-A on living Lec2 cells. b Overlay of DIC, eGFP, and mCherry signals of a confluent layer of co-cultured fluorescent Lec2 cells (actin-mCherry and H2B-eGFP) and unlabeled Lec2-JAM-A cells. c, d FD-based AFM topography image (c) and corresponding adhesion map (d) of adjacent cells indicated in the dashed square in b. The adhesion map shows interactions mainly between T3SA+ particles and Lec2-JAM-A cells (white pixels). For higher visibility, the pixel size in the adhesion image was enlarged two-fold. e DFS plot of T3SA+ interactions with JAM-A on model surfaces (grey circles, taken from Fig. 4b—upper panel) and living cells (red dots). Histogram of the force distribution observed on cells fitted with a multi-peak Gaussian distribution (n = 600 data points) is shown on the side. f Box plot of BF observed for T3SA+ (grey) and T3SA− (white) virions, with (hatched lines) and without injection of JAM-A Ab (10 µg/ml). The horizontal line within the box indicates the median, boundaries of the box indicate the 25th and 75th percentile, and the whiskers indicate the highest and lowest values of the results. The square in the box indicates the mean. For all experiments, data are representative of at least n = 5 independent experiments. g Influence of JAM-A on virus binding determined using flow cytometry. Cells were incubated with either no virions (Mock) or Alexa Flour 488-labeled T3SA+ or T3SA− virions (105 particles per cell), and the median fluorescence intensity (MFI) of cell-bound virus was determined by flow cytometry as shown in Supplementary Fig. 3a. Error bars indicate s.d. of the mean value. Experiments were repeated twice (n = 2 independent experiments, each with duplicate samples). ns, P > 0.05; *P < 0.05; ****P < 0.0001; determined by two-sample t-test in Origin (f) and by two-way ANOVA corrected for multiple comparisons using Tukey’s test in GraphPad Prism (g), respectively. Source data are provided as a Source Data file

