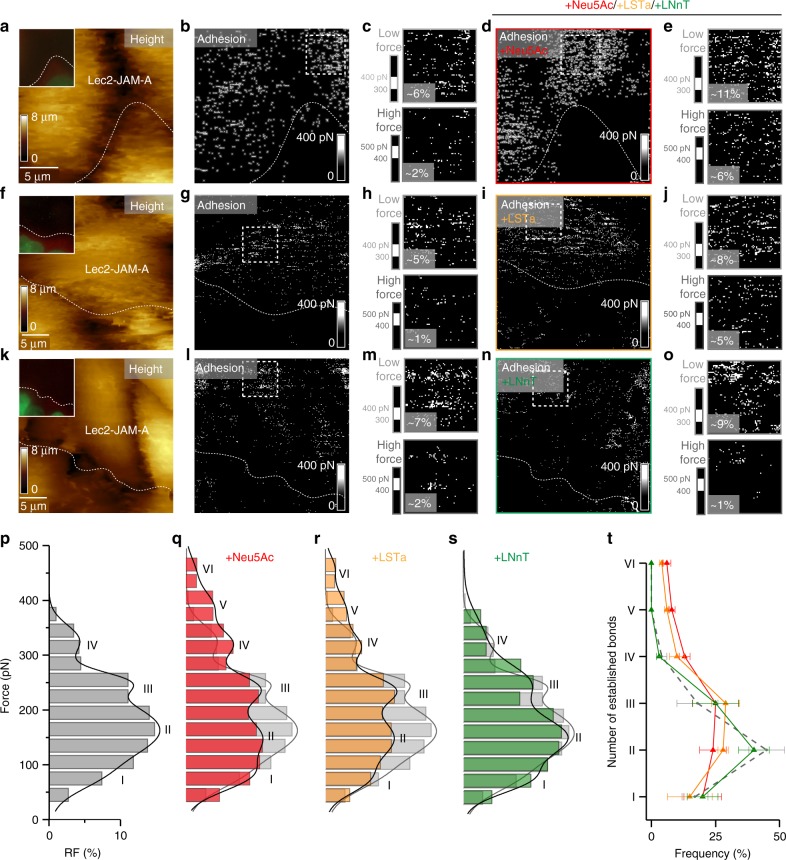
Fig. 7.
Monitoring the effect of SA addition on reovirus binding to living cells. T3SA+ binding to Lec2-JAM-A cells was assessed before and after adding 1 mM Neu5Ac (a–e), 1 mM LSTa (f–j), or 1 mM LNnT (k–o). a, f, k AFM topography image of adjacent Lec2 and Lec2-JAM-A cells with fluorescent image (20 × 20 µm) inset showing fluorescently-tagged Lec2 cell lacking JAM-A expression. b, g, l Corresponding adhesion map recorded before injection of glycan. c, h, m Enlarged images of adhesion maps recorded on Lec2-JAM-A cells (dashed square in adhesion map). The upper images display the lower force range (300 to 400 pN), whereas the lower images display the higher force range (400 to 500 pN), with significantly fewer adhesion events. d, i, n Adhesion maps recorded following injection of free Neu5Ac (d), LSTa (i), or LNnT (n). The area probed is similar to the area recorded before glycan injection. e, j, o Enlarged images of adhesion maps recorded on Lec2-JAM-A cells (dashed square in adhesion map and similar areas as in b, g, i show more adhesion events in the high-force range upon injection of sialylated glycan [Neu5a and LSTa] and no significant change for non-sialylated glycan [LNnT]). The frequency of adhesion events is indicated. (p–s) Histogram of the force distribution extracted on Lec2-JAM-A cells (dashed square in adhesion map) before (p) and after adding Neu5Ac (q), LSTa (r), and LNnT (s) (n > 700 for each condition). Histograms were fitted with a multi-peak Gaussian distribution. t Number of bonds established between JAM-A cell-surface receptors and T3SA+ before (grey dashed) and after injection of sialylated or non-sialylated glycans (colored). Error bars indicate s.d. of the mean value. The statistical analysis is shown in Supplementary Table 1. For all experiments, data are representative of at least n = 15 cells from n = 5 independent experiments. Source data are provided as a Source Data file

