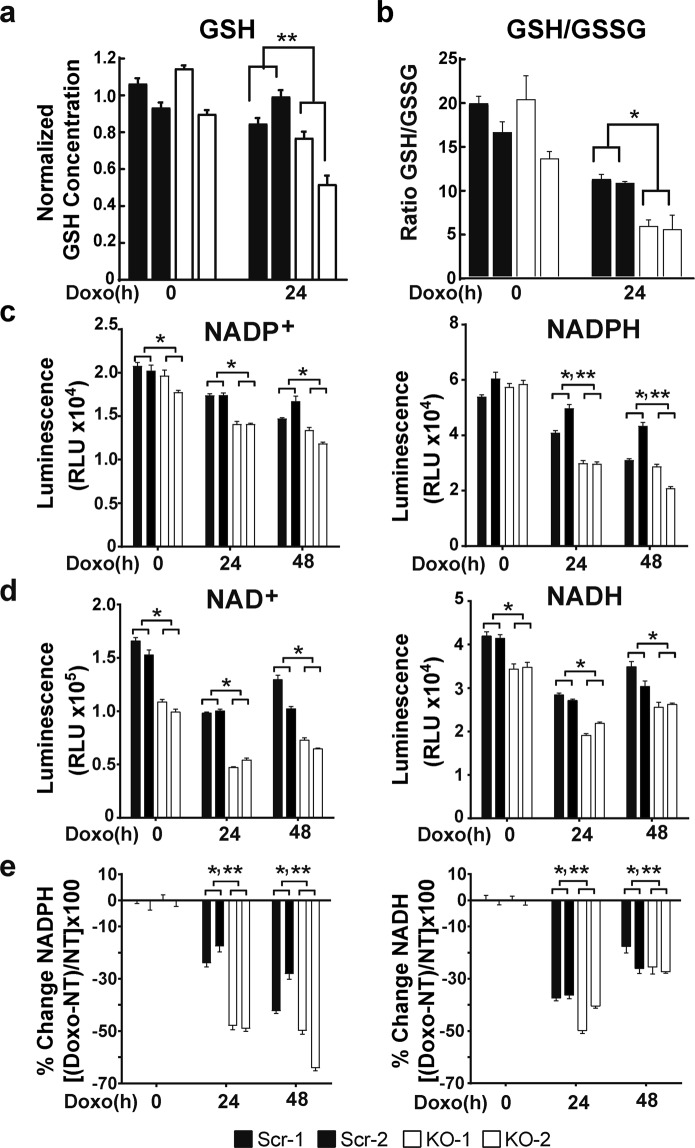
Figure 1.
GSH, NADP+/NADPH, and NAD+/NADH levels are significantly reduced in TRPM2 depleted cells. (a,b) GSH concentration was measured in two clones of SH-SY5Y cells in which TRPM2 was depleted (KO-1 and KO-2) and in scrambled controls (Scr-1 and Scr-2). Cells were untreated or treated with 0.3 µM doxorubicin for 24 hours (Doxo 24 h). (a) In three experiments, the GSH concentration of each measurement was normalized to the average of each experiment’s untreated scrambled controls. Normalized means ± SEM are shown. **p < 0.0001, group x doxorubicin exposure time interaction effect, KO vs scrambled, two-way ANOVA. (b) Concentrations of GSH and GSSG were measured in triplicate and ratios calculated for each clone. A representative experiment of three is shown. *p < 0.01, group effect, two-way ANOVA. (c) NADP+ and NADPH or (d) NAD+ and NADH were measured in SH-SY5Y Scr or KO clones untreated or treated with 0.3 µM doxorubicin for 24 or 48 hours. Four experiments were performed and measurements from one representative experiment (n = 4 replicates) are shown. *p < 0.0001, group effect; **p < 0.0001, group x doxorubicin exposure time interaction effect, two way ANOVA. (e) Comparison of percent change in NADPH and NADH for each group [(NADPH or NADH in doxorubicin treated cells - untreated cells) divided by untreated cells, X 100%]. *p < 0.0001, group effect; **p < 0.03, group x doxorubicin exposure time interaction effect, two way ANOVA.

