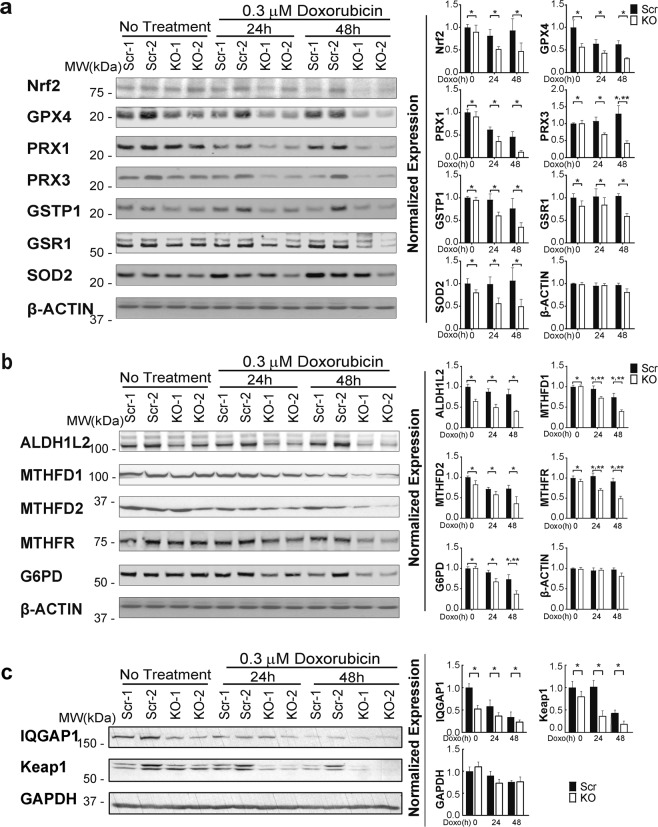
Figure 2.
Nrf2, downstream antioxidant enzymes, and IQGAP1 are reduced in TRPM2 depleted cells following doxorubicin. SH-SY5Y Scr and TRPM2 KO clones were untreated or treated with 0.3 µM doxorubicin for 24 or 48 hours. Data from representative Western blots from three independent experiments are shown in (a–c). Intensify of bands was quantitated and measurements were normalized by comparing bands to each protein’s time 0 average scrambled control. Normalized means ± SEM for Scr and KO cells at each time point from three experiments are shown (n = 6 replicates) are shown to the right of the blots. (a) Western blotting was performed with antibodies to Nrf2, GPX4, PRX1, PRX3, GSTP1, GSR1, SOD2, and actin. p values analyzed with two-way ANOVA: Nrf2 (*p = 0.035), GPX4 (*p = 0.0002), PRX1 (*p = 0.0036), PRX3 (*p = 0.0002), GSTP1 (*p = 0.01), GSR1 (*p = 0.011), SOD2 (*p < 0.01), actin (p < 0.282), group effect; PRX3 (**p < 0.004), group x doxorubicin exposure time interaction effect. (b) Western blotting was performed with antibodies to ALDH1L2, MTHFD1, MTHFD2, MTHFR, and G6PD. p values analyzed with two-way ANOVA: ALDH1L2, MTHFD1, and MTHFR (*p < 0.0001), MTHFD2 (*p = 0.0135), G6PD (*p = 0.002), actin (p < 0.282), group effect; MTHFD1 and MTHFR (**p ≤ 0.02), G6PD (**p = 0.045), group x doxorubicin exposure time interaction effect. (c) Western blotting was performed with antibodies to IQGAP1, Keap1, and GAPDH. *p < 0.0014, group effect, two-way ANOVA.

