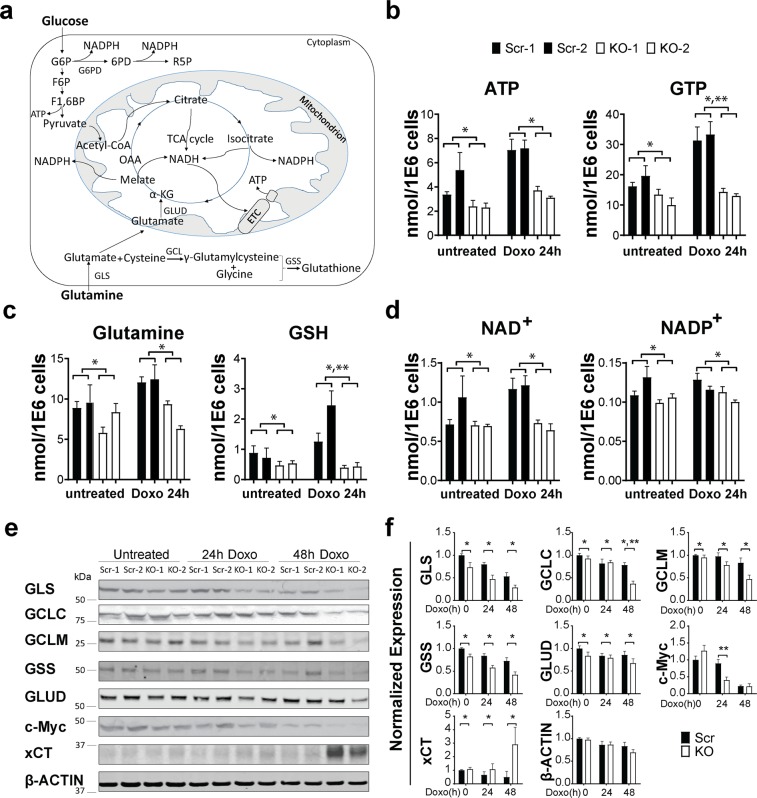
Figure 4.
Decreased glutamine levels contribute to reduced GSH in TRPM2 depleted cells. (a) Schema of glutamine metabolism and GSH production. (b–d) Metabolomic quantitation of TRPM2 depleted and scrambled control cells treated with or without doxorubicin (n = 6 replicates/group) showed decreased (b) ATP and GTP, (c) glutamine and GSH, and (d) NAD+ and NADP+ in KO cells compared to scrambled control. *p ≤ 0.003, group effect; **p < 0.005, group x doxorubicin exposure time interaction effect, two way ANOVA. (e) Western blotting of proteins involved in GSH and α-ketoglutarate synthesis including GLS, GCLC, GCLM, GSS, GLUD, c-Myc, xCT, and β-actin. Representative blots from three experiments are shown. Densitometry measurements were normalized to the average of each blots’ untreated scrambled controls and mean densitometry measurements from the three experiments are shown in (f). p values analyzed with two-way ANOVA: GLS and GSS (*p < 0.0001), GCLC (*p < 0.007), GCLM (*p < 0.003), GLUD (*p < 0.04), xCT (*p < 0.05), group effect; GCLC (**p = 0.006), c-Myc (**p = 0.002), group x doxorubicin exposure time interaction effect.

