Fig. 1.
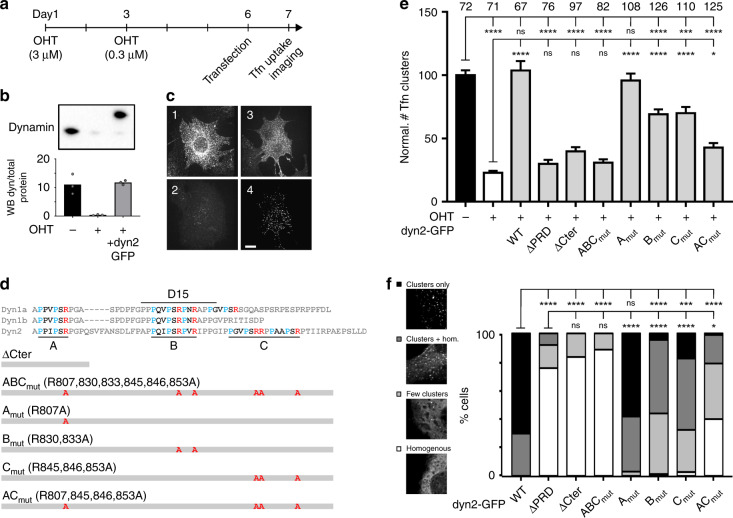
Rescue of endocytosis in dynamin TKO cells with PRD mutant dynamins. a Protocol for dynamin knock-out and rescue. After 6 days of gene excision of the three dynamin genes following hydroxytamoxifen (OHT) treatment, cells are transfected with electroporation. Tfn uptake and imaging assays are performed the next day. b Western blot with pan-dynamin antibody on untreated cells, cells treated with OHT or cells treated with OHT and transfected with dynamin2-GFP. Note the migration at higher molecular weight of dyn2-GFP. Bottom, quantification in three experiments of the WB signal normalized to the total amount of protein. See Supplementary Fig. 1A for full gels and blots. c Example images (red channel) of cells incubated with Tfn-A458 for five minutes, washed and fixed. (1) Not treated with OHT, (2) treated with OHT, (3) treated with OHT and transfected with dyn2-GFP. (4) GFP channel of the cell shown in (3). Scale bar 10 µm. d Sequences of the C terminal parts of the PRD of dyn1 (a and b splice variants) and dyn2, with the class-II SH3 binding motifs A, B and C indicated. Below, mutants of dyn2 used to rescue Tfn-A568 uptake with the corresponding mutations. e Quantification of Tfn-A568 uptake, expressed as the density of detected clusters for cells treated with OHT and transfected with dyn2-GFP mutants as indicated. The number of cells imaged in four different experiments is indicated on top of each condition. The graphs show the average ± SEM for each dyn2 mutant. The adjusted p values of one-way ANOVA followed by Tukey’s multiple comparison tests are shown in Supplementary Table 3. f Quantification of dyn2-GFP localization in transfected TKO cells. Each cell was evaluated blind with a score ranging from homogenous labelling (white) to punctuate labelling without homogenous (black), with intermediates (mostly homogenous with few clusters, light grey; some homogenous with distinct clusters, dark grey). Examples in the left illustrate this scoring. Histograms show the proportion of each category of labelling. Stars indicate statistical significance (Kruskal–Wallis test followed by Dunn’s multiple comparison tests, p values in Supplementary Table 4)

