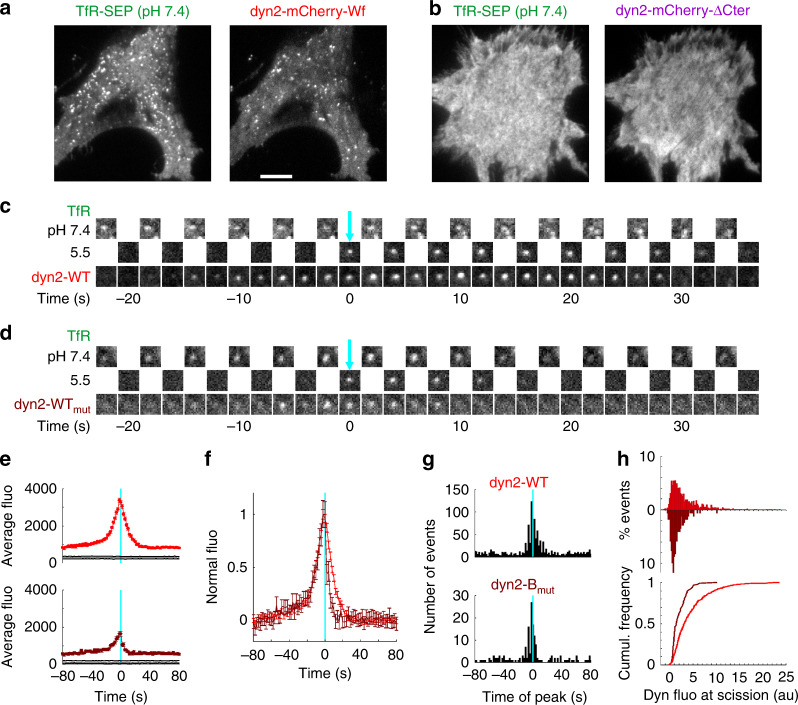
Fig. 3.
Kinetics of dynamin recruitment to forming CCVs measure with ppH. a, b Images of a TKO cell co-transfected with TfR-SEP and dyn2-mCherry-WT (a) or dyn2-mCherry-ΔCter (b). Note the punctuated pattern of both markers with dyn2-WT which becomes homogenous with dyn2ΔCter. Scale bar 10 µm. c,Example of a scission event recorded in the cell shown in A. Note the transient recruitment of dyn2-mCherry-WT which peaks around time 0. d Same as h for a TKO cell co-transfected with TfR-SEP and dyn2-mCherry-Bmut. e Average fluorescence of dyn2-mCherry of events recorded in cells co-transfected with TfR-SEP and dyn2-mCherry-WT (top, red trace, 1193 events in 5 cells) or dyn-mcherry-Bmut (bottom, brown trace, 171 events in 7 cells) and aligned to the time of scission (cyan line). The black lines indicate 95% confidence intervals for significant recruitment. f The curves in (e) are normalized to their peak. g Histograms of the timing of peak dyn2 recruitment in single events relative to scission (cyan lane). h Histograms (top) and cumulative distributions (bottom) of the amplitude of dyn2-mCherry at the time of scission for events recorded with a peak recruitment within 10 s before or after scission (580 and 97 events in cells transfected with dyn2-mCherry-WT, in red, and dyn2-mCherry-Bmut, in brown, histogram reversed, respectively)

