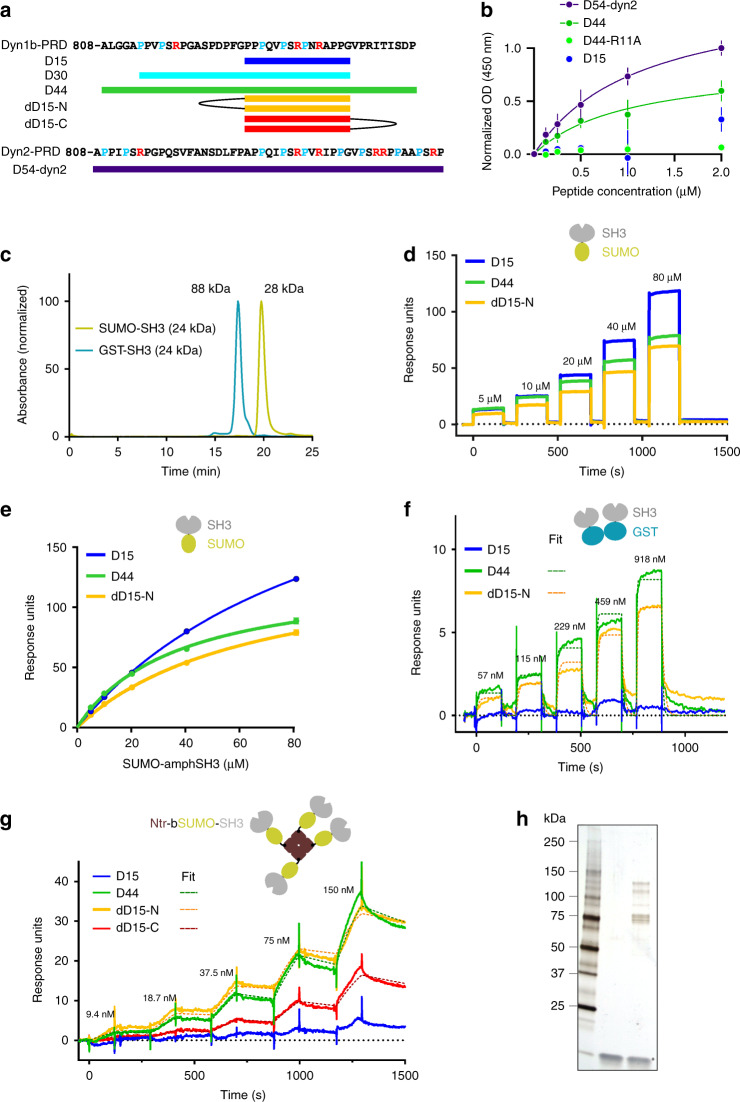
Fig. 4.
Binding of mono- and multimeric SH3 domains to D15-based peptides. a Scheme of the peptides used in this study, based on dynamin1b (top) and dynamin2 (bottom) PRDs. b ELISA to evaluate the respective binding properties of biotinylated peptides to surface-bound SUMO-SH3 domains (KD = 1.12 and 1.01 µM for D54-dyn2 and D44 respectively, the other peptides were not fitted). Each data point represents the average of two independent experiments with two technical replicates each. c Retention times of SUMO-SH3 and GST-SH3 measured by size exclusion chromatography. The theoretical molecular weights are indicated. For SUMO-SH3 the elution peak corresponds to 28 kDa, close to the expected monomer, whereas for GST-SH3 it corresponds to 88 kDa, close to the expected size of a dimer. d Representative sensorgrams of SUMO-SH3 binding at indicated concentrations to immobilized peptides. Note the fast on and off rates for all peptides consistent with weak and transient interactions. e Steady-state KDs calculated from the data in (d) (three replicate experiments): 102 ± 2 µM (D15), 37 ± 2 µM (D44), 66 ± 3 µM (dD15-N). f Representative sensorgrams of GST-SH3 binding at indicated concentrations to immobilized peptides. The scheme on top (GST in blue, SH3 in grey) indicates that this protein likely forms dimers (see b). Dotted lines represent fits with estimated KDs of 572 nM (D44) and 509 nM (dD15-N). g Representative sensorgrams of Ntr-bSUMO-SH3 binding at indicated concentrations to immobilized peptides. The scheme on top shows the multimeric complex formed by bSUMO-SH3 bound to tetrameric neutravidin (brown). Dotted lines represent fits with estimated KDs of 17 nM (D44), 4.5 nM (dD15-N) and 34 nM (dD15-C). Note the change in kinetics (slower off rates) for D44 and the multimeric peptides (dD15-N and dD15-C). h Silver stain of rat brain lysate pull-down with no peptide (middle) or biotinylated dD15-N (right)

