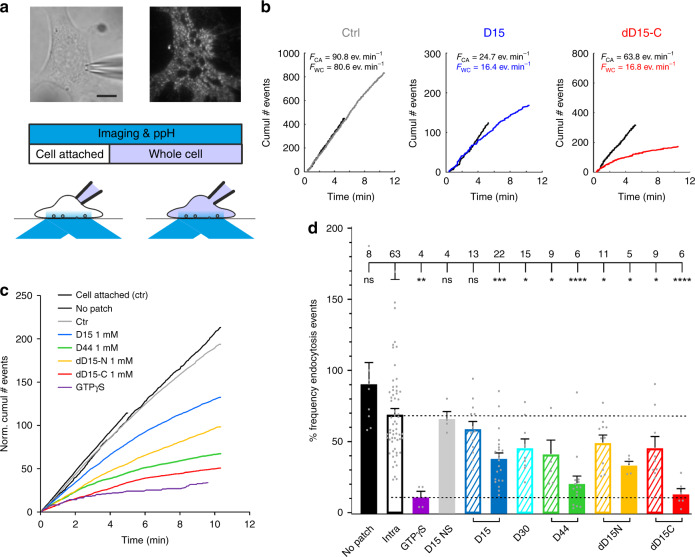
Fig. 5.
Effect of D15-based peptides on CME monitored with the ppH assay. a Experimental design. Top, images of a 3T3 cell recorded with a patch-clamp electrode (seen on the transmitted light image, left) and transfected with TfR-SEP imaged with TIRF microscopy (right). The cells are recorded for at least 15 min with the ppH assay. In the first 5 min, the cell is in the cell attached configuration (left) and in the last 10 min in the whole cell configuration (right). Scale bar 5 µm. b Examples of recordings of cells with internal solutions containing no peptide (Ctrl, left), 1 mM D15 (middle) or 1 mM dD15-C (right). Black lines represent the cumulative number of detected endocytosis events over time in cell attached configuration. They are all straight lines, indicating that the event frequency remains constant during recording. This frequency FCA is written on top of the graph. Lines in colour represent the cumulative number of events in whole cell configuration. Note that at early time points these curves are tangential to the corresponding curves in cell attached, indicating the same endocytosis activity. In the example with the control solution, the slope of this curve remains constant with only a slight deflection towards the end of the recording. On the other hand, the deflections are much more marked with solution containing inhibitory peptides. The frequency FWC in the last two minutes of the whole cell recording is indicated on top of the graphs. c Averages of curves normalized to the corresponding cell attached recordings and displayed as in (b) for all the conditions tested in this study. d Average ± SEM of the ratio of event frequency measured 8–10 min in whole cell over event frequency 3–5 min in cell attached for the same cell. The number of recordings for each condition is indicated on top of the graph, and each individual measure is indicated by a grey circle. Recording solutions contain 100 µM (hatched bars) or 1 mM (plain bars) of the indicated peptide. Stars indicate statistical significance for difference (1-way ANOVA followed by Tukey’s multiple comparison tests, Supplementary Table 5)

