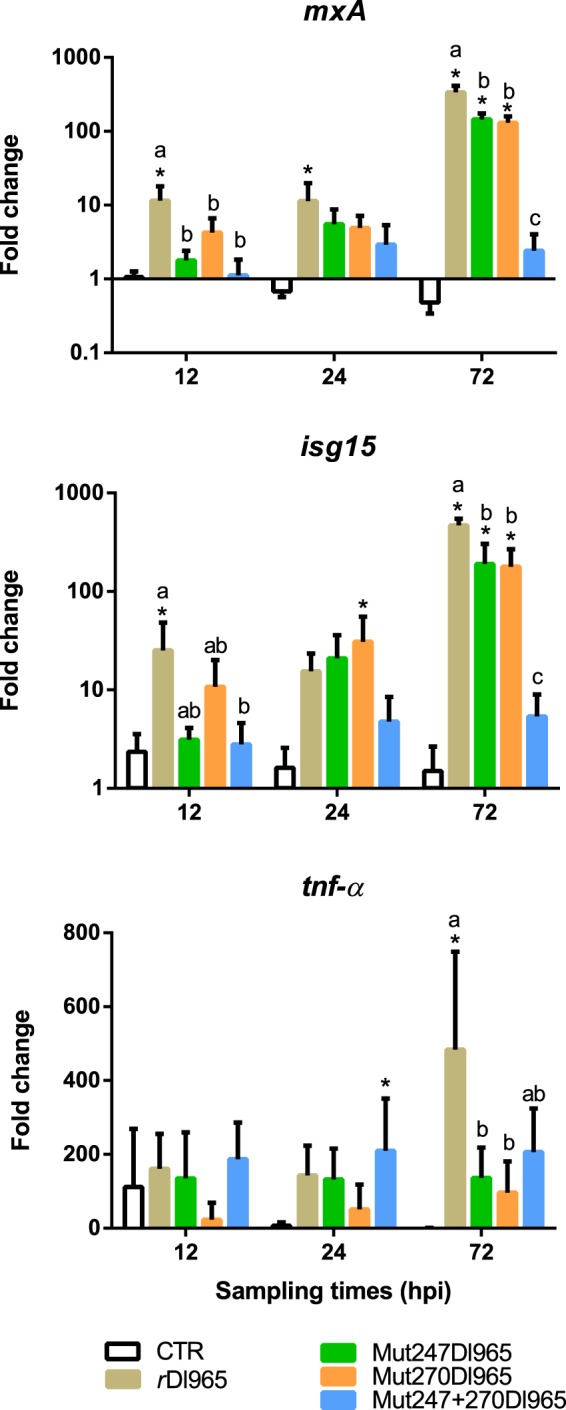
Figure 4.

Relative quantification of mxA, isg15 and tnf-α transcription after inoculation with rDl965 or mutated viruses. Data were statistically analysed with the one-way ANOVA test. Asterisk indicates significant differences between L-15-injected (negative control) and virus-inoculated fish within each sampling time (p < 0.05). Different letters denote significant differences among experimental groups at the same sampling time (p < 0.05). Results are mean ± s.d. (n = 5).
