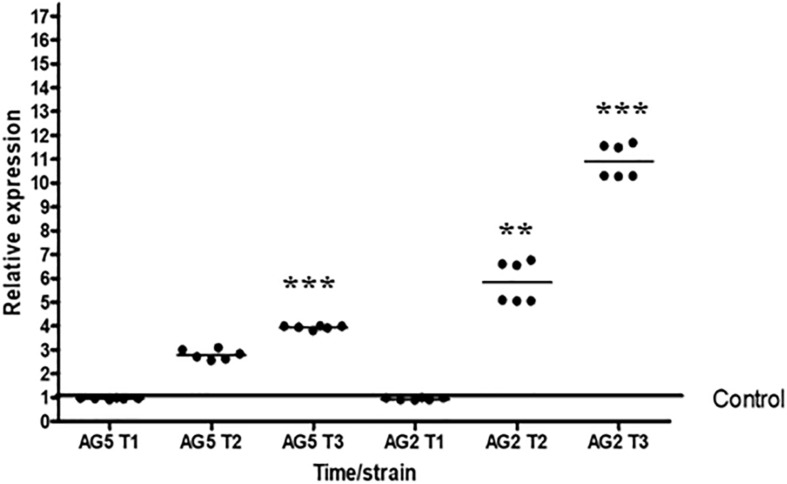
FIGURE 3.
Expression of Tal6 is affected in the presence of phytopathogens. qRT-PCR expression assay of Tal6 in T. atroviride wild type in confrontation with R. solani AG2 and AG5. Mycelia was collected before the contact (T1), during the contact (T2) and after the contact (T3). Mycelia of Trichoderma cultured alone was used as control. Glyceraldehyde phosphate dehydrogenase gene (gpd) was used as endogenous expression control. Beeswarm scatter plot shows the results obtained of two biological replicates with three technical replicates. Control line represents the normalized expression of Tal6 without the presence of phytopathogens. Data were analyzed using an ANOVA non-parametric test. Asterisks represent statistical differences between the control condition and the treatments. ∗∗p < 0.01 and ∗∗∗ p < 0.001.

