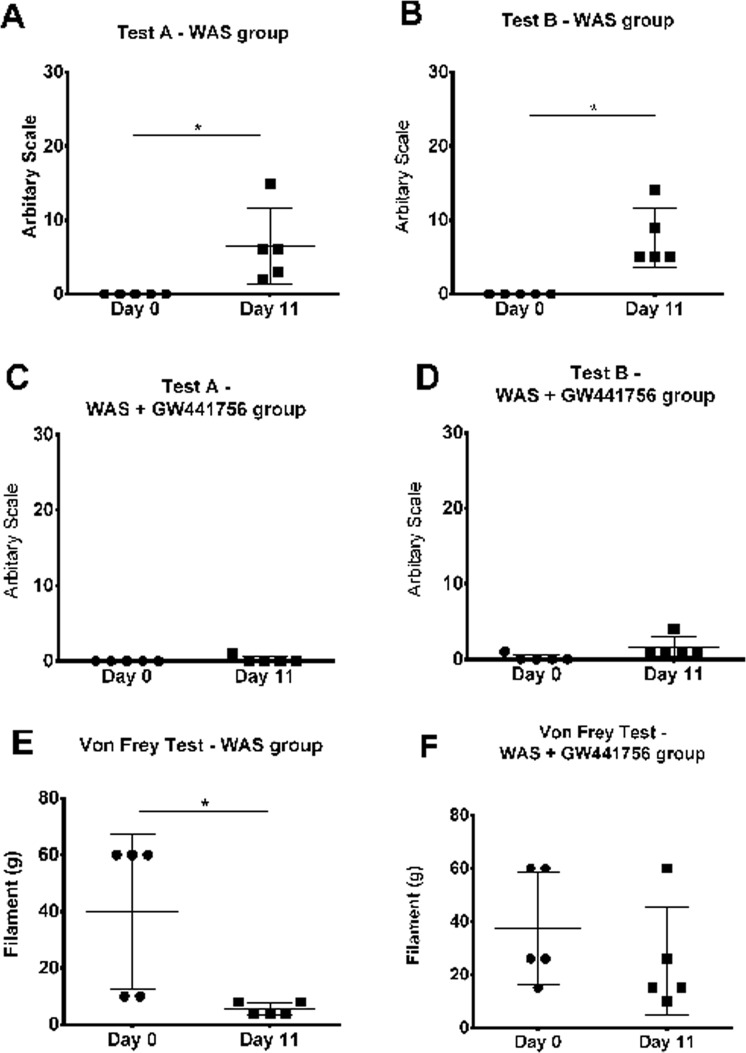
Figure 2.
Scatter graph showing pain related behaviour arbitrary values before (day 0) and after (day 11) WAS induction for test A (A) and test B (B). Scatter graph showing pain related behaviour arbitrary values before (day 0) and after (day 11) WAS+ Trk A antagonist GW441756 (WAS+ GW441756) administration for test A (C) and test B. (D) Scatter graph showing the lower abdominal mechanical pain threshold using Von Frey filaments before (day 0) and after (day 11) WAS induction (E) and before (day 0) and after (day 11) WAS+ Trk A antagonist GW441756 (WAS + GW441756) administration (F). *p < 0.05.

