
Figure 3.
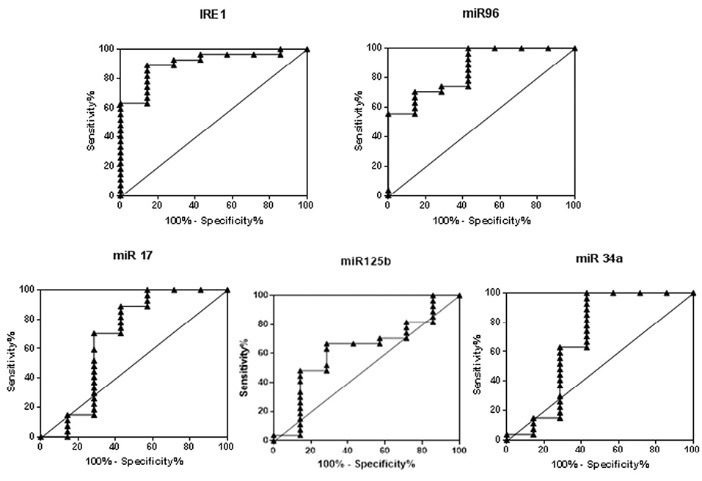
ROC curve of IRE1 and its targeted miRs in discrimination between RA patients and healthy controls. The AUC values for miR-17, miR-34a, miR-96, and miR-125b are 0.9048, 0.6772, 0.6878, 0.8571 and 0.6243, respectively.
Official websites use .gov
A
.gov website belongs to an official
government organization in the United States.
Secure .gov websites use HTTPS
A lock (
) or https:// means you've safely
connected to the .gov website. Share sensitive
information only on official, secure websites.
ROC curve of IRE1 and its targeted miRs in discrimination between RA patients and healthy controls. The AUC values for miR-17, miR-34a, miR-96, and miR-125b are 0.9048, 0.6772, 0.6878, 0.8571 and 0.6243, respectively.