
Figure 4.
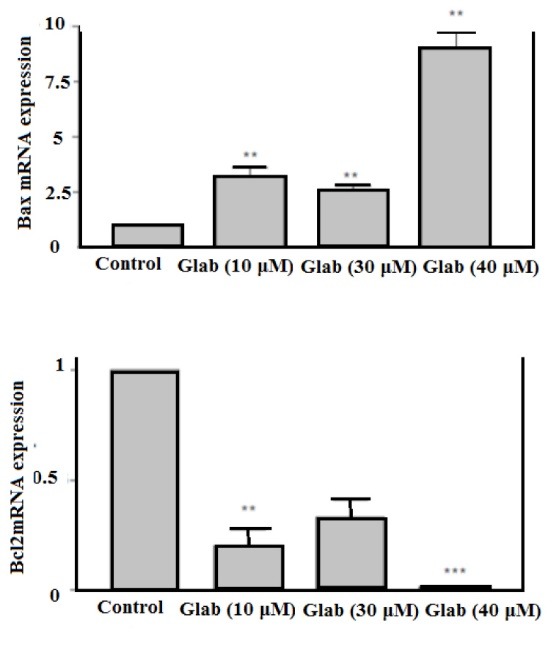
The effect of Glab on Bax and Bcl-2 gene expressions of H1299 Cells. Data are expressed as the mean± SEM of three separate experiments. ** P < 0.01, *** P < 0.001 vs. control.
Official websites use .gov
A
.gov website belongs to an official
government organization in the United States.
Secure .gov websites use HTTPS
A lock (
) or https:// means you've safely
connected to the .gov website. Share sensitive
information only on official, secure websites.
The effect of Glab on Bax and Bcl-2 gene expressions of H1299 Cells. Data are expressed as the mean± SEM of three separate experiments. ** P < 0.01, *** P < 0.001 vs. control.