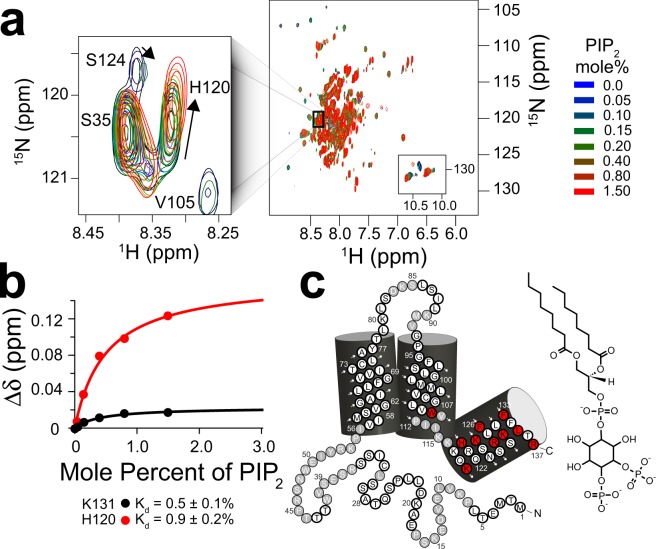
Figure 2.
The PIRT polybasic C-terminal helix binds PIP2. (a) Overlay of eight 15N-TROSY HSQC hPIRT NMR spectra colored as a function of increasing PIP2 concentration. The left inset shows changes in H120 resonance position as the lipid is titrated. (b) Representative chemical shift perturbation (Δδ) titration plots for hPIRT K131 and H120 which are fit to a single binding site model as described in the methods. (c) hPIRT residues that specifically bind PIP2 are highlighted red on the topology plot.

