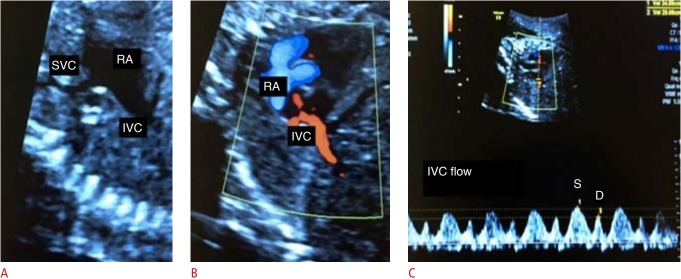
Fig. 7. Assessment of blood flow from the inferior vena cava (IVC).
A. Two-dimensional image demonstrates the bicaval plane. B. Two-dimensional color Doppler image demonstrates the IVC. C. Spectral Doppler waveforms of the IVC are shown. SVC, superior vena cava; RA, right atrium; S, peak systolic wave velocity; D, peak diastolic wave velocity.

