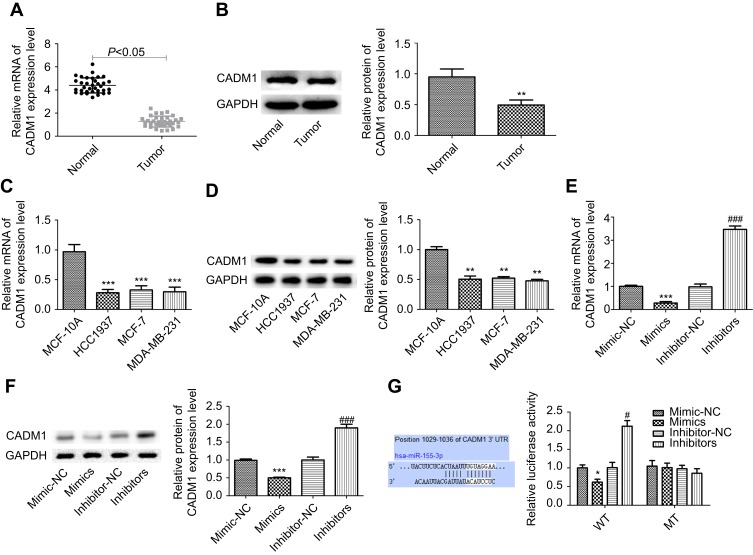
Figure 3.
miR-155-3p down-regulated CADM1 expression in breast cancer cells. (A–B) RT-PCR and WB analysis of the mRNA and protein levels of CADM1 in 30 paired breast cancer tissues and adjacent non-tumor tissues, and the repressive WB figure was shown in 3B (n=30; *P<0.05, **P<0.01, tumor group vs control group). (C–D) RT-PCR and WB analysis of the mRNA and protein levels of CADM1 in breast cancer HCC1973, MCF-7 and MDA-MB-231 cell lines (n=3; **P<0.01, ***P<0.001, HCC1973/MCF-7/MDA-MB-231 group vs MCF 10A group). (E–F) RT-PCR and WB analysis of the mRNA and protein levels of CADM1 after MCF-7 cells were transfected with miR-155-3p mimics, inhibitors or their controls (n=3, ***P<0.001, mimics group vs mimic-NC group; ###P<0.001, inhibitors group vs inhibitor-NC group). (G) The luciferase activity of CADM1 promoter after transfection in MCF-7 cells with miR-155-3p MT (mutation) or WT (wild type) (n=3, *P<0.05, mimics groups vs mimic-NC group; #P<0.05, inhibitors group vs inhibitor-NC group).

