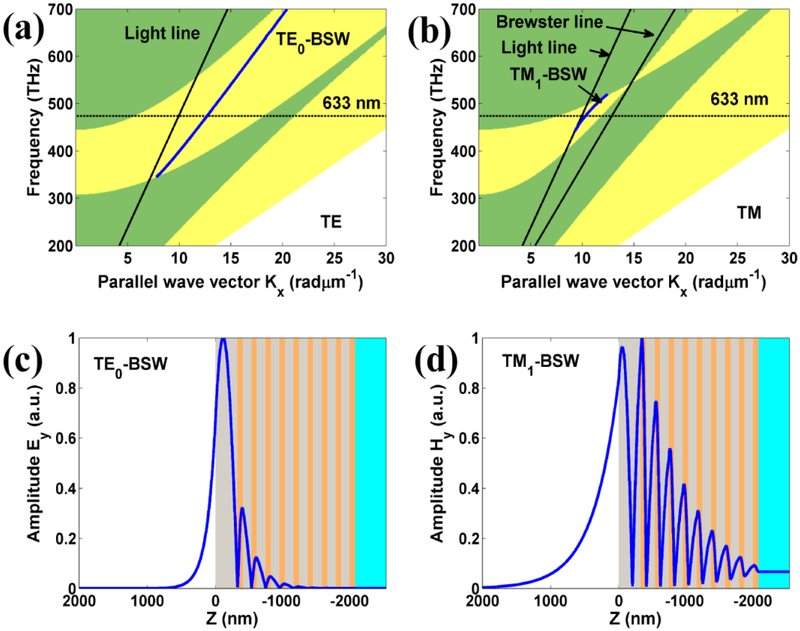
FIG. 2.
The projected band structure of the dielectric multilayer for (a) TE polarization, (b) TM polarization. The yellow zone denotes the stop band. The blue solid lines denote the dispersion curves for BSW with the thickness h =320 nm. (c) The electric field distribution for TE0-BSW. (d) The magnetic field distribution for TM1-BSW. The field distributions are calculated at the wavelength 633 nm.

