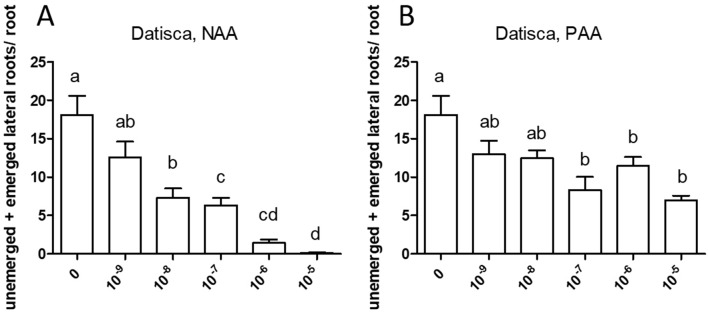
Figure 7.
Effect of NAA (A) and PAA (B) on branching of the seedling root of Datisca glomerata. The figure shows the number of emerged and unemerged lateral roots (primordia) per main root. Values represent means ± SEM. One-way ANOVA with Tukey’s post hoc test was used to assess significant differences between treatment groups. Values labeled with different letters are significantly different (p ≤ 0.05). n = 9–12.

