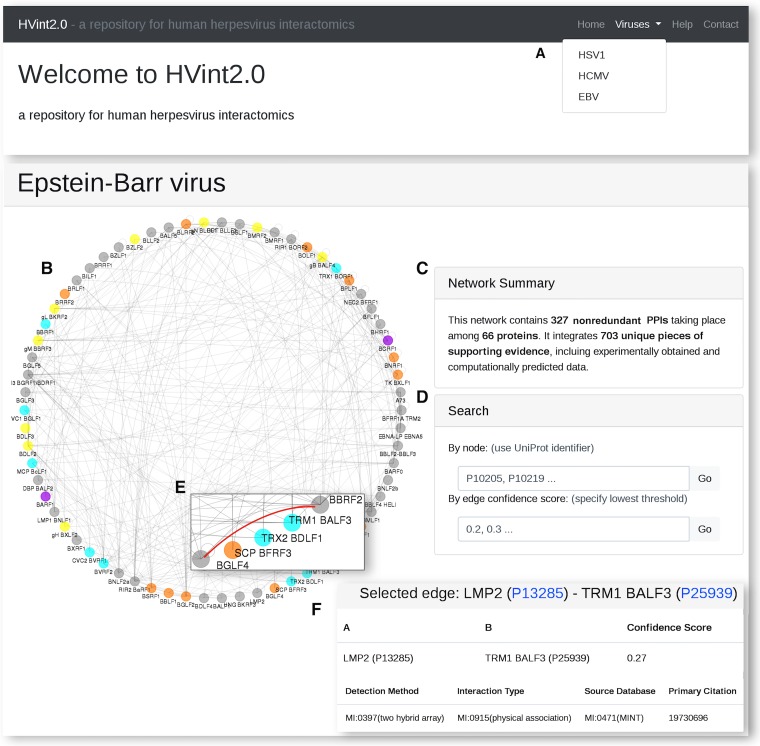
FIG 6.
HVint2.0 web interface. (A) Each interactome can be accessed from the top dropdown menu. (B and C) For each interactome, the website provides both a graphical representation of the network and a brief summary. (D) Search tools to subset the full network based on node identifiers or edge confidence threshold. (E) Alternatively, specific nodes and edges of interest can be selected from the graphical display. (F) For each selection, the corresponding subnetwork is rendered and its associated data provided in tabular format.

