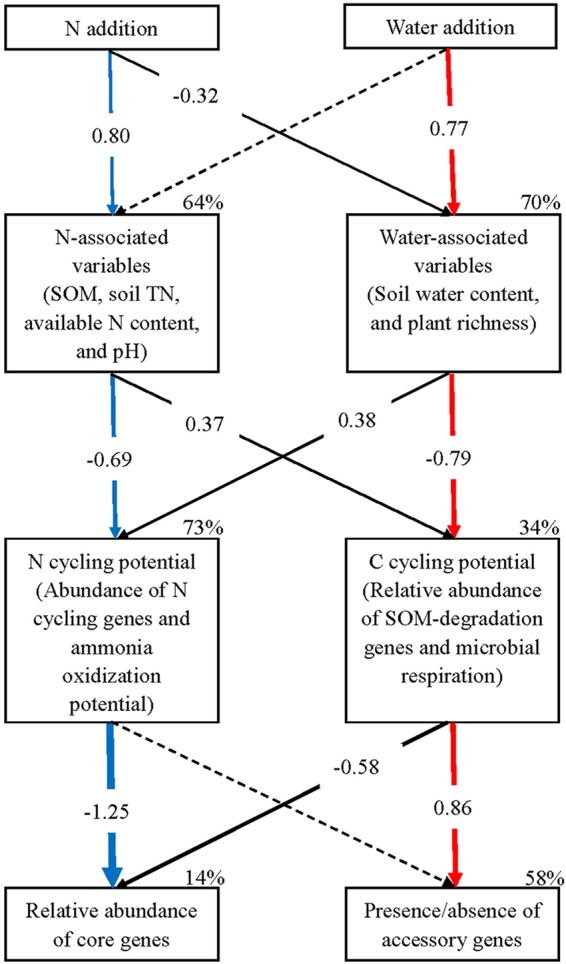
FIG 4.

Structural equation model analysis of the effects of N and water addition on both the core and accessory genes of soil microbial communities. The final model fit the data well: χ2 = 10.750, P = 0.706, df = 14. Numbers in the solid arrows (P < 0.05) are standardized path coefficients (equivalent to correlation coefficients), while the arrow width indicates the strength of the relationships. The dashed arrows indicate nonsignificant relationships (P > 0.05). Percentages close to variables indicate the variance explained by the model (R2). TN, total N.
