
Figure 4.
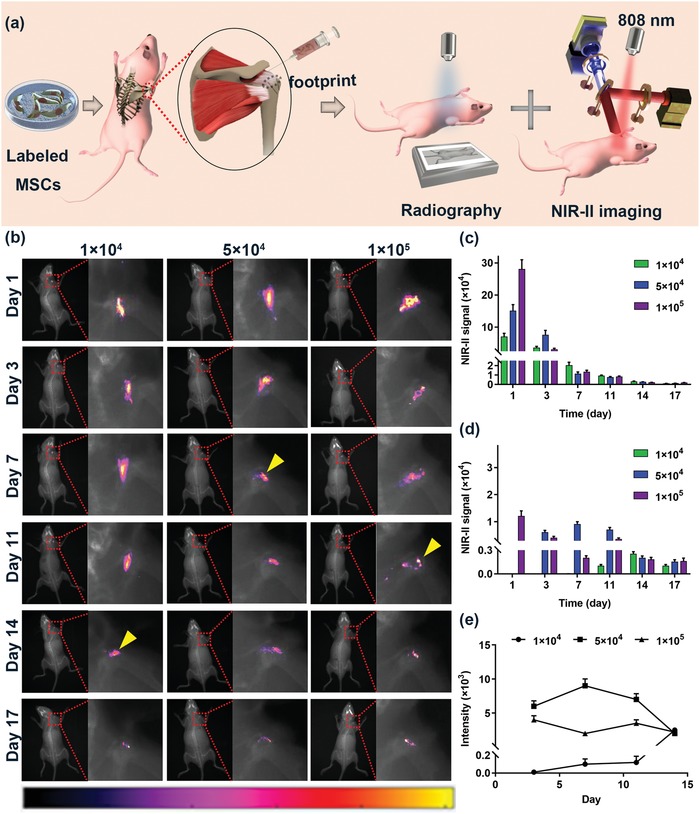
In vivo migration and distribution of intra‐articular injected MSCs. a) Schematic illustration of the radiography and NIR‐II imaging strategy. b) The time course of the migration and distribution of labeled MSCs; the yellow arrows indicated over 50% labeled MSCs started to retain near footprint. c) Quantitative measurement of the whole NIR‐II signal intensity in each group. d) Quantitative measurement of the NIR‐II signal intensity near the footprint. e) The time course of NIR‐II signal intensity near the footprint during enthesis repair stage.