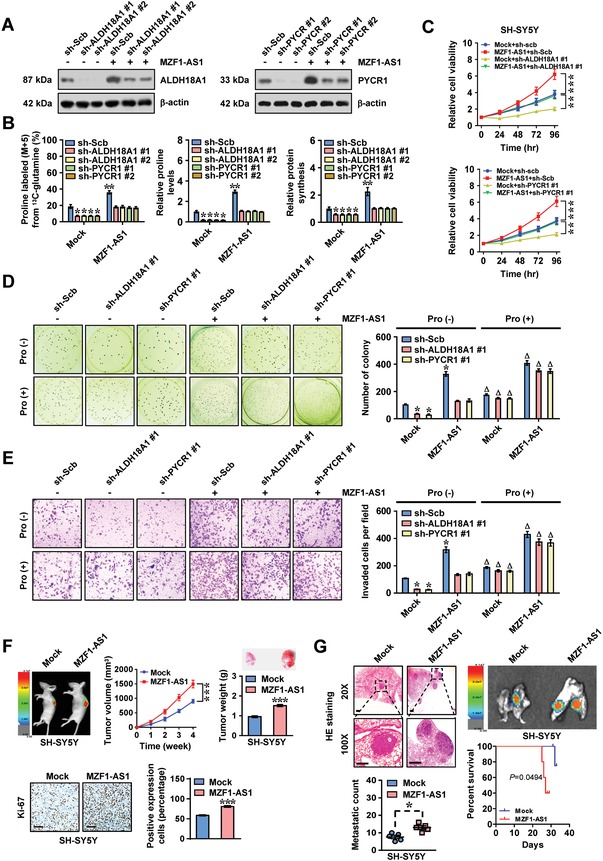
Figure 3.

MZF1‐AS1 promotes proline synthesis and NB progression. A) Western blot assay indicating the levels of ALDH18A1 or PYCR1 in SH‐SY5Y cells stably transfected with empty vector (mock) or MZF1‐AS1, and those co‐transfected with scramble shRNA (sh‐Scb), sh‐ALDH18A1, or sh‐PYCR1. B) 13C glutamine‐to‐proline conversion (left panel), proline levels (middle panel), and de novo protein synthesis (right panel) in NB cells stably transfected with mock or MZF1‐AS1, and those co‐transfected with sh‐Scb, sh‐ALDH18A1, or sh‐PYCR1. C–E) MTT C) colorimetric, representative images (left panel) and quantification (right panel) of D) soft agar and E) matrigel invasion assays showing the viability, anchorage‐independent growth, and invasion of SH‐SY5Y cells stably transfected with mock or MZF1‐AS1, and those co‐transfected with sh‐Scb, sh‐ALDH18A1 #1, or sh‐PYCR1 #1, with or without proline (Pro, 3 × 10⁻³ m) supplementation (n = 4). F) Representative images (left upper panel), in vivo growth curve (middle upper panel), weight at the end points (right upper panel), representative images (left lower panel) and quantification (right lower panel) of Ki‐67 expression of xenograft tumors formed by subcutaneous injection of SH‐SY5Y cells stably transfected with mock or MZF1‐AS1 into dorsal flanks of nude mice (n = 5 per group). G) Hematoxylin and eosin (H&E) staining (left upper panel), representative images (right upper panel), metastatic counts of lungs (left lower panel), and Kaplan–Meier curves (right lower panel) of nude mice (n = 5 per group) treated with tail vein injection of SH‐SY5Y cells stably transfected with mock or MZF1‐AS1. Scale bar: 100 µm. Student's t‐test and analysis of variance compared difference in panels (B)–(G). Log‐rank test for survival comparison in panel (G). *P < 0.05, ** P < 0.01, *** P < 0.001 versus mock+sh‐Scb or mock. Δ P < 0.05 versus Pro (‐). Data are shown as mean ± s.e.m. (error bars) and representative of three independent experiments in panels (A)–(E).
