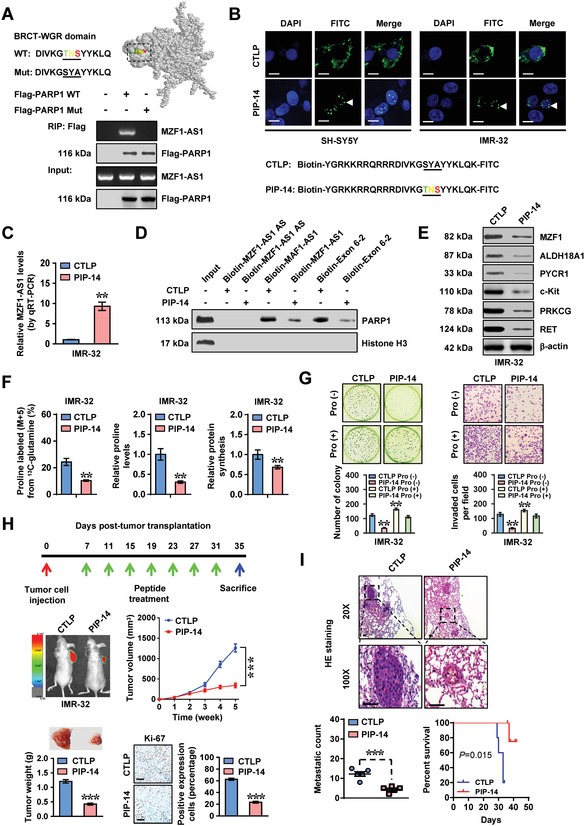
Figure 7.

Therapeutic blocking MZF1‐AS1‐PARP1 interaction inhibits proline synthesis and NB progression. A) Solution structure (upper panel) for BRCT‐WGR domain of PARP1 analyzed by Jmol program (http://www.jmol.org). RIP assay indicating the interaction of Flag‐tagged wild‐type (WT) or mutant (Mut) PARP1 with MZF1‐AS1 in IMR‐32 cells. B) Representative images showing the distribution of FITC‐labeled mutant control peptide (CTLP) or inhibitory peptide (PIP‐14, 40 µmol L−1) in IMR‐32 cells (at 48 h), with nuclei staining by DAPI. Scale bars: 10 µm. C) Real‐time qRT‐PCR (normalized to input) indicating the levels of MZF1‐AS1 pulled down by biotin‐labeled CTLP or PIP‐14 (40 µmol L−1) from IMR‐32 cells (n = 4). D) Biotin‐labeled RNA pull‐down assay revealing the interaction of sense or antisense (AS) MZF1‐AS1 with PARP1 in IMR‐32 cells treated with CTLP or PIP‐14 (40 µmol L−1). E) Western blot showing the expression of MZF1‐AS1 target genes in IMR‐32 cells treated with CTLP or PIP‐14 (20 µmol L−1) for 48 h. F) 13C glutamine‐to‐proline conversion (left panel), proline levels (middle panel), and global protein synthesis (right panel) in IMR‐32 cells treated with CTLP or PIP‐14 (20 µmol L−1) for 48 h (n = 5). G) Representative images and quantification of soft agar (left panel) and matrigel invasion (right panel) assays indicating the anchorage‐independent growth and invasion of IMR‐32 cells treated with CTLP or PIP‐14 (20 µmol L−1) for 48 h (n = 5), with or without proline (Pro, 3 × 10⁻³ m) supplementation. H) Representative images (left middle panel), in vivo growth curve (right middle panel), tumor weight (left lower panel), and Ki‐67 immunostaining (right lower panel) of xenograft tumors formed by subcutaneous injection of IMR‐32 into the dorsal flanks of nude mice (n = 5 per group) that treated with intratumoral administration of CTLP or PIP‐14 (3 mg kg−1) as indicated (upper panel). I) H&E staining images and metastatic counts of lungs (upper and left lower panels) and Kaplan–Meier curves (right lower panel) of nude mice (n = 5 per group) treated with tail vein injection of IMR‐32 cells and CTLP or PIP‐14 (3 mg kg−1). Student's t‐test and analysis of variance compared the difference in panel (C) and panels (F)–(I). Log‐rank test for survival comparison in panel (I). ** P < 0.01, *** P < 0.001 versus CTLP or CTLP Pro (–). Data are shown as mean ± s.e.m. (error bars) and representative of three independent experiments in panels (A)–(G).
