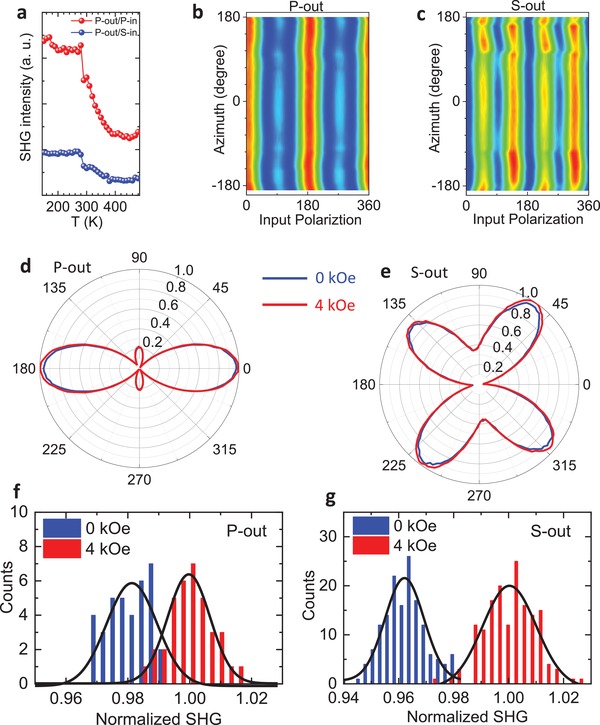
Figure 2.

a) Temperature dependence of the SHG intensity for P‐out polarization. b,c) The SHG intensity (295 K) at different azimuth angles while rotating the sample along the z‐axis for P‐out and S‐out polarizations, respectively. d,e) Comparison of the SHG signals (295 K) at 4 kOe (red curve) and zero field (blue curve) for P‐out and S‐out polarizations, respectively. The magnetic field is applied along the z‐axis. f,g) Histogram of the SHG intensity (295 K) at 4 kOe (red) and zero field (blue) for P‐out and S‐out polarizations, respectively.
