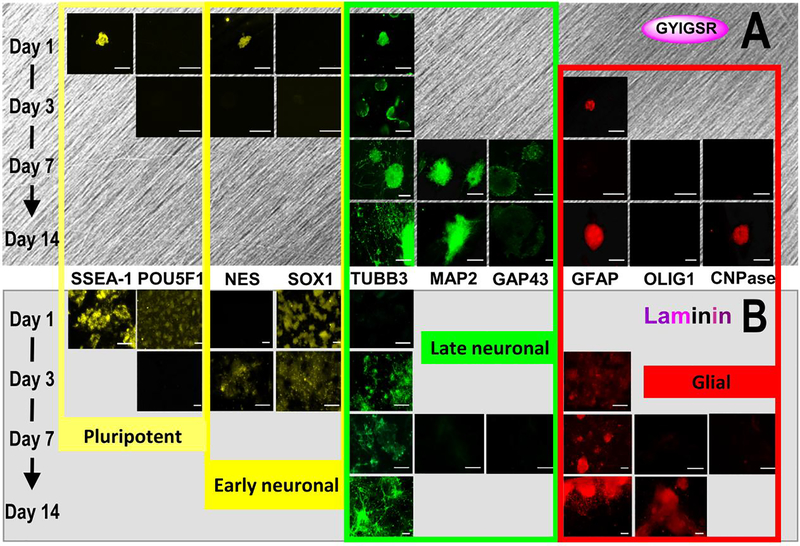
Figure 3.
Protein expression during differentiation on YIGSR-aligned fibers and laminin over 14 days. Displayed images are from the 3rd quartile of fluorescent intensity for each protein. Expression is noted as typical for pluripotent state (SSEA-1, POU5F1), neural progenitors (NES, SOX1) neural (TUBB3, MAP2, GAP43) and glial cells (GFAP, OLIG1, CNPase), scale bars = 100 μm. Images indicate similar neural differentiation on (A) aligned GYIGSR-functionalized nanofiber scaffolds and (B) laminin glasses but with faster rates on fibers (earlier expression of NES, TUBB3, MAP2 and GAP43 on aligned fibers). ICC images were enhanced (+40% brightness, +20% contrast).

