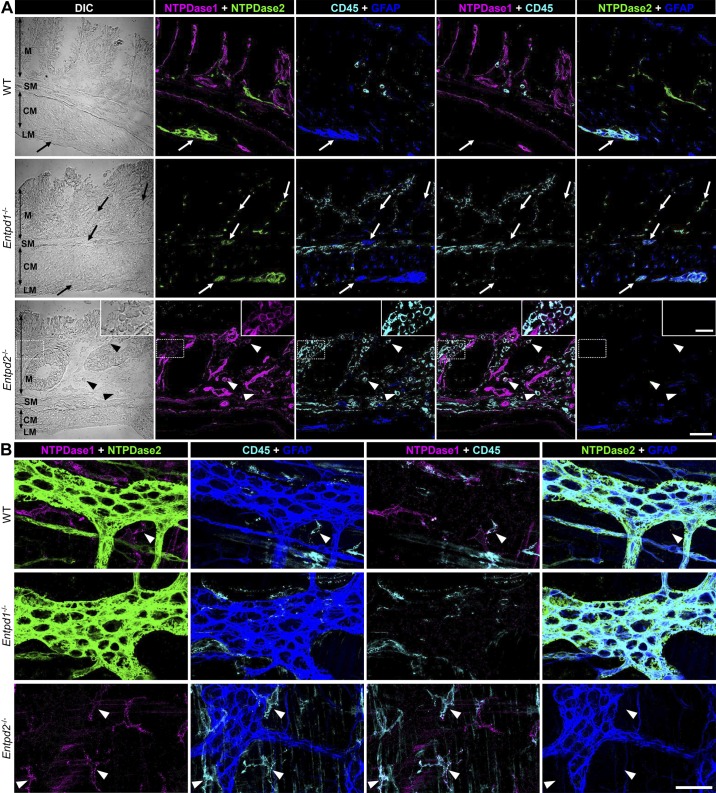
Fig. 3.
Expression of nucleoside triphosphate diphosphohydrolase-1 and -2 (NTPDase1 and -2) within the gut wall 2 wk after the dextran sulfate sodium (DSS) treatment. A: 2 wk after the DSS treatment, cross sections of distal colons from wild-type (WT; top row), Entpd1−/− (middle row), and Entpd2−/− (bottom row) mice were stained for NTPDase1 (magenta), NTPDase2 (green), pan-leukocyte marker CD45 (cyan), and glial fibrillary acidic protein (GFAP; blue). NTPDase1 and -2 immunoreactivity (-ir) patterns were similar to the healthy controls (Fig. 1) colocalizing with immune cell marker (arrowheads) and with enteric glia (arrows), respectively. Scale bar = 50 µm. Dotted rectangle in the bottom row is enlarged in inset (scale bar = 20 µm). CM, circular muscle; DIC, differential interference contrast; LM, longitudinal muscle; M, mucosa; MP, myenteric plexus; SM, submucosa; SMP submucosal plexus. B: expression of NTPDase1 and NTPDase2 within the myenteric plexus 2 wk after the DSS treatment. Longitudinal muscle-myenteric plexus preparations of distal colons from the DSS-treated WT (top row), Entpd1−/− (middle row), and Entpd2−/− (bottom row) mice were stained for NTPDase1 (magenta), NTPDase2 (green), CD45 (cyan), and GFAP (blue). Note that NTPDase1 and NTPDase2 keep distinct cellular localization after acute intestinal inflammation, colocalizing with either immune cells or enteric glia, respectively. Scale bar = 50 µm. These are representative images from 5 Entpd1−/−, 4 Entpd2−/−, and 4 WT mice.

