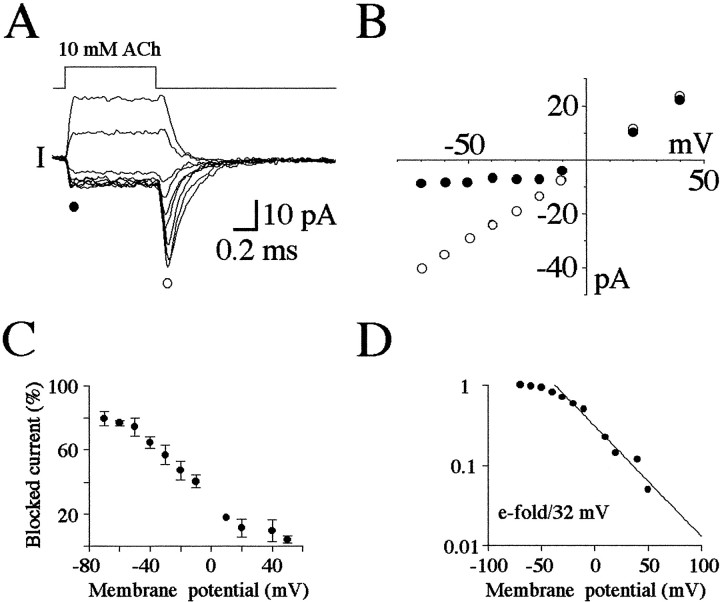
Fig. 2.
Voltage dependence of the effect of 10 mm ACh. A, Series of current responses evoked in the same patch upon exposure to 10 mm ACh at potentials of +40, +20, −10, −20, −30, −40, −50, −60, and −70 mV (from top to bottom traces; averages of 8 trials). The filled circle denotes the early plateau phase, and the open circle denotes the peak of the rebound phase. B, Plot of the current during the early plateau phase (filled circles) and peak of the rebound phase (open circles) at each potential examined for the traces shown in A. C, Summary of the difference between the peak rebound current and early plateau current (Blocked current), plotted as a percentage of the total current observed at each potential. SDs (n = 5) are indicated by the error bars.D, Same results as in C normalized for the maximal block (at −70 mV) on a logarithmic scale and plotted as a function of voltage. The solid line is the best linear fit of the foot of the curve and indicates an e-fold increase in block for a 32 mV hyperpolarization.

