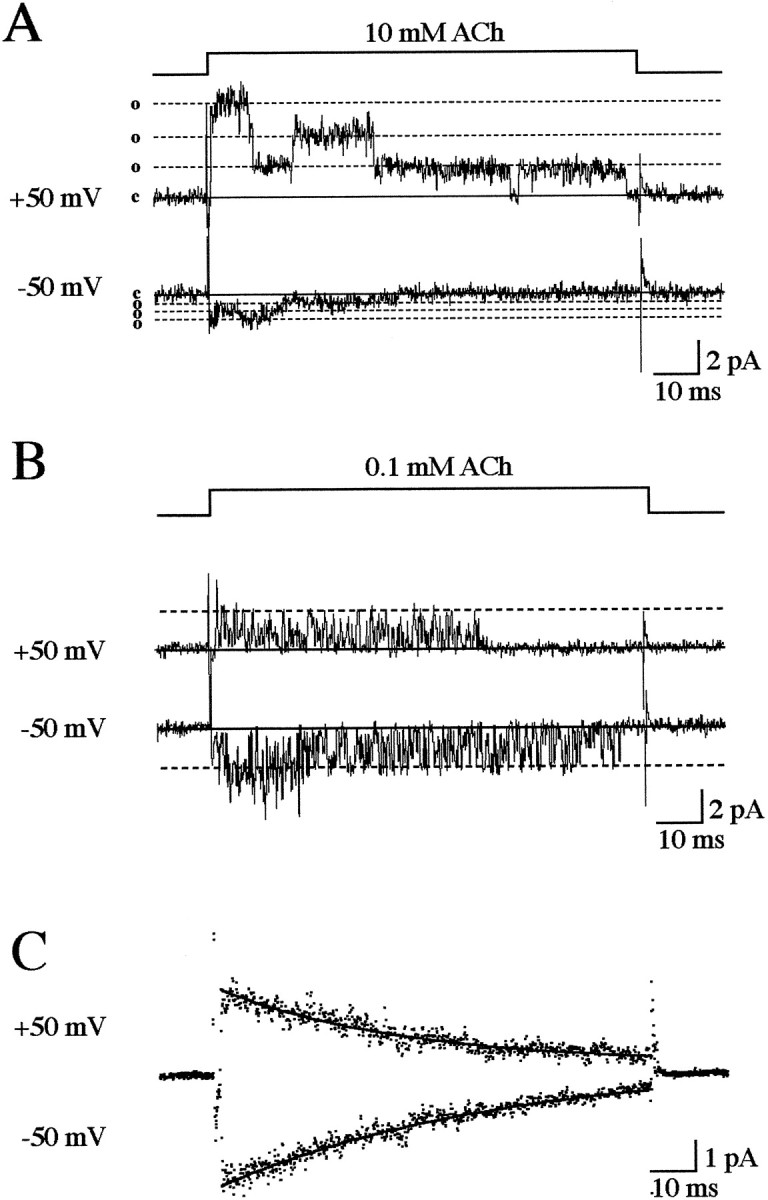
Fig. 3.

Open channel block by ACh. A, Thetop line indicates the 100 msec period of application of 10 mm ACh to a patch containing three AChRs. The top trace shows the current (filtered at 2 kHz) elicited during a single application at +50 mV. The baseline is indicated byc on the left; each of three consecutive open channel current levels are indicated by o. Thebottom trace shows a response by the same patch during ACh application at −50 mV. Note the much smaller current amplitude.B, In contrast, the single channel current was insensitive to voltage when 0.1 mm ACh was applied to the same patch. C, Long pulses (100 msec) of 0.1 mm ACh also evoked a voltage-independent desensitization in this patch. In this example, 45 traces were averaged. At both voltages (+50 and −50 mV), the averaged trace decayed with a time course, which was well fitted by a single exponential curve with time constants (●d) of 43 msec at +50 mV and 64 msec at −50 mV.
