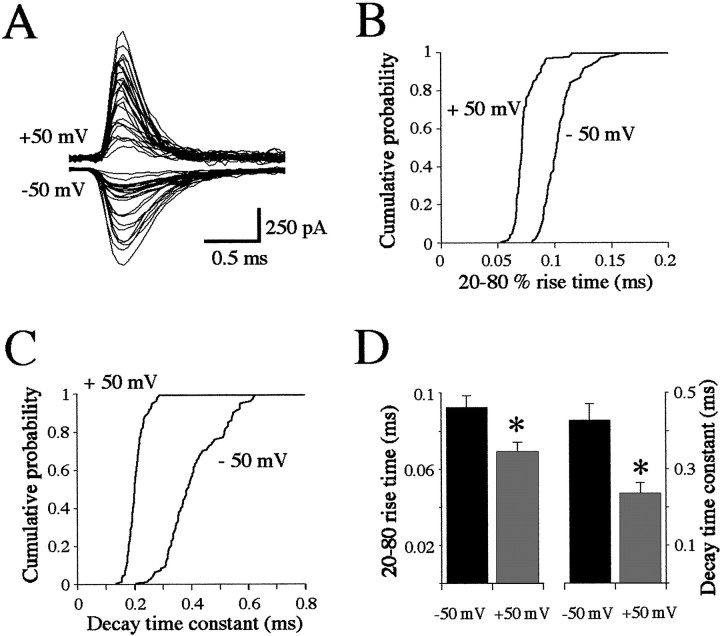
Fig. 5.
Properties of mEPCs recorded in vivo. A, Overlap of 25 mEPCs recorded from the same muscle fiber at +50 (top traces) and −50 (bottom traces) mV. Cumulative histograms of the 20–80% rise times (B) and monoexponential decay time constants (C) for all events recorded at +50 (n = 99) and −50 (n = 85) mV.D, Summary histogram of the values obtained in all (n = 15) recordings. The mean ± SD for the rise times (left) and decay time constants (right) at −50 (black bars) and +50 (gray bars) mV. The asterisksindicate significance at p < 0.01.

