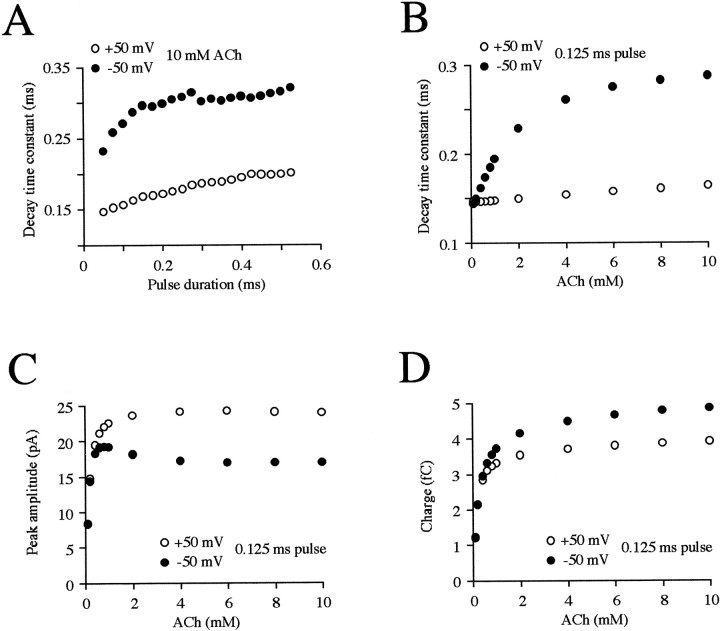
Fig. 6.
Effects of model parameters on predicted properties of the mEPC. A, Decay time constants are plotted as a function of the duration of a square pulse of 10 mm ACh. The values for the durations are incremented by 0.025 msec from 0.050 to 0.525 msec at −50 (filled symbols) and +50 (open symbols) mV. Effects of the ACh concentration on decay time constants (B), peak amplitudes (C), and charge (D) during a 0.125 msec pulse. The concentrations are 0.1, 0.2, 0.4, 0.6, 0.8, 1, 2, 4, 6, 8, and 10 mm.

