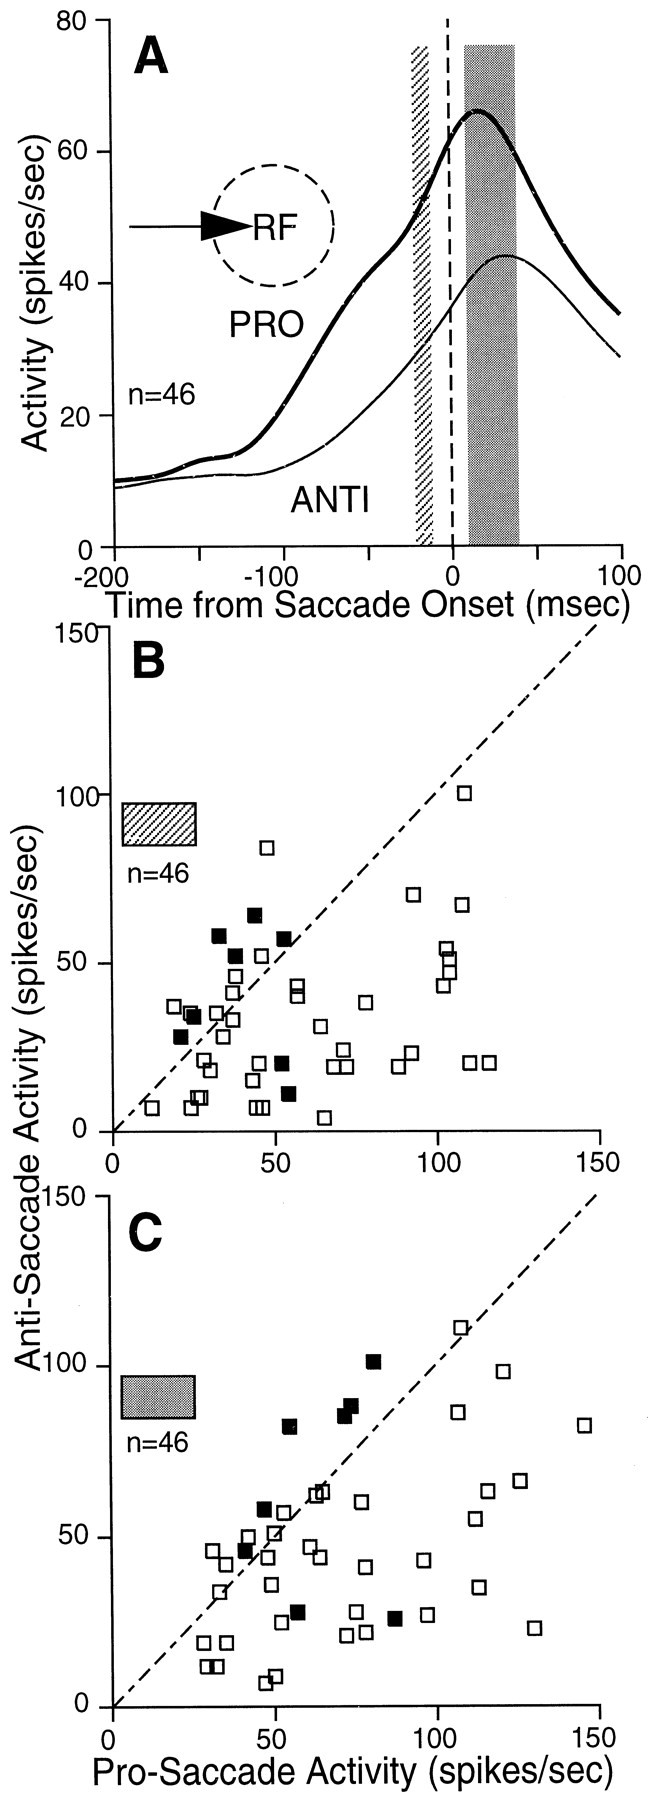
Fig. 11.

Saccade-related activity. A, Mean spike density of the sample of neurons on pro-saccade trials (thick line) and anti-saccade trials (thin line) for saccades into the response field of the neurons.B, The pre-saccade activity in the interval 20–10 msec before saccade onset (A, hatched area) of individual neurons on pro-saccade trials is plotted against the pre-saccade activity on anti-saccade. The oblique dashed linerepresents the unity line (slope, 1). Filled squaresindicate antidromically activated neurons. C, The saccade activity (A, shaded area) of individual neurons on pro-saccade trials is plotted against the saccade activity on anti-saccade trials.
