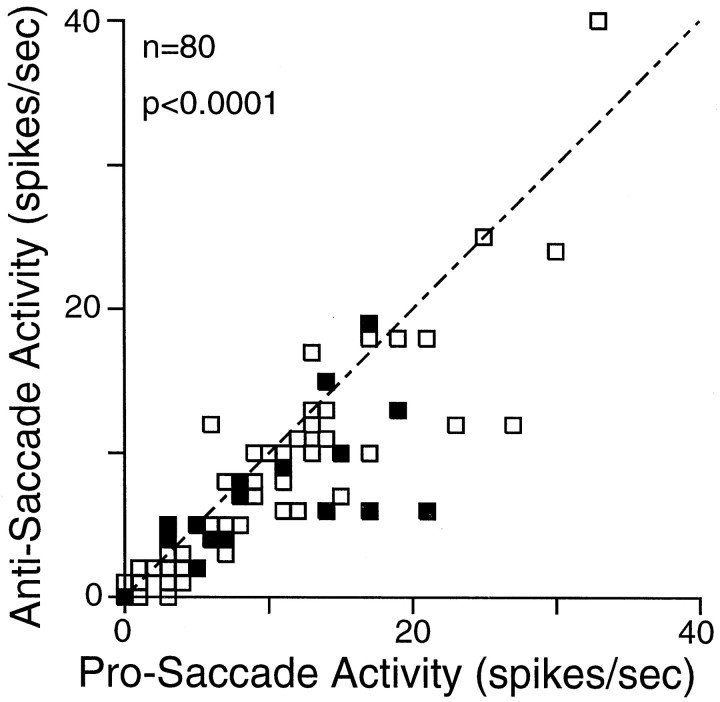
Fig. 4.
Activity during the instruction period. The mean discharge rate of individual neurons in the period 400–200 msec before stimulus presentation on pro-saccade trials is plotted against the mean activity on anti-saccade trials. Filled squares indicate antidromically activated corticotectal neurons. Dashed line is the unity line (slope, 1).

