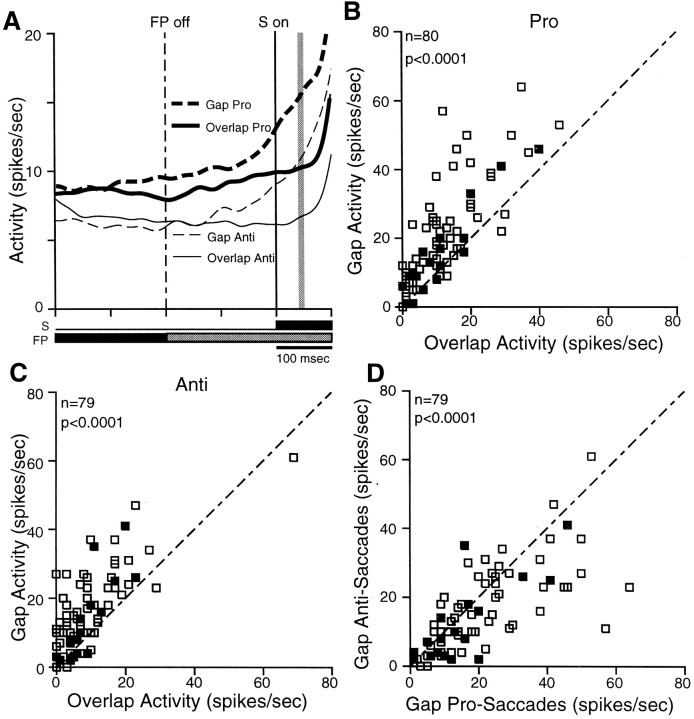
Fig. 5.
Prestimulus activity on overlap and gap trials.A, Mean spike density on pro-saccade trials (thick lines) and anti-saccade trials (thin lines) in the overlap (solid lines) and gap (dashed lines) conditions. B, The mean discharge rate of individual neurons in the period 40–50 msec after stimulus presentation (A, shaded region) on overlap pro trials (mean, 11.7 ± 1.1 spikes/sec) is plotted against the mean activity on gap pro trials (mean, 19.8 ± 1.6 spikes/sec).Filled squares indicate antidromically activated neurons. Dashed line is the unity line (slope, 1).C, Same as in B but for the comparison of anti-saccades between the gap (mean, 15.7 ± 1.1 spikes/sec) and overlap condition (mean, 9.0 ± 1.4 spikes/sec). D,Same as in B but for the comparison between pro- and anti-saccades in the gap condition.

