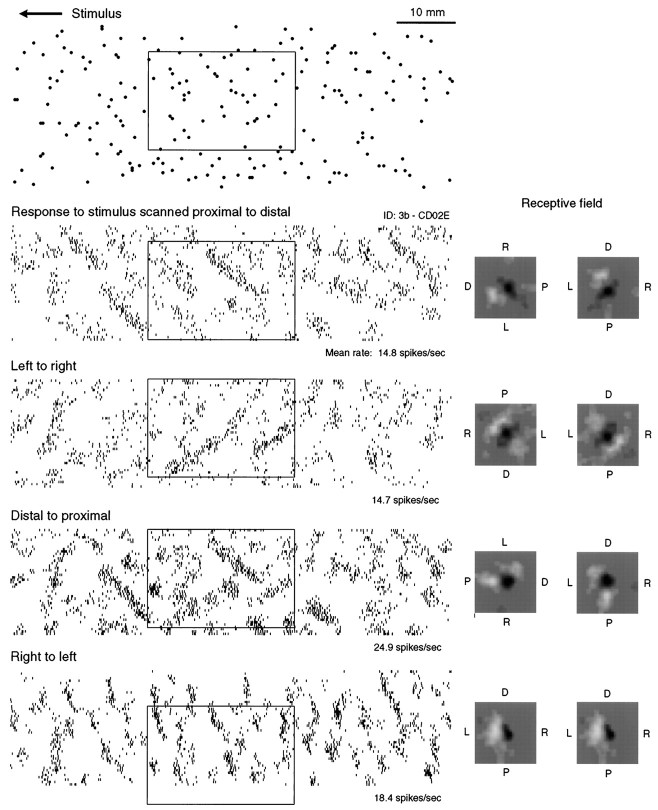
Fig. 1.
Effect of scanning direction on the response and RF of a typical area 3b neuron. Part of the random-dot pattern (∼40% of the entire pattern) is shown at the top. Eachdot on the plot illustrates the location of a stimulus element, 400 μm in relief and 500 μm in diameter. The neuron's responses in each scanning direction is shown as a spatialraster. Each tick mark represents a single action potential plotted at the stimulus position (top) when the action potential occurred (time flows from left to right across each raster). The box in each raster shows the neuron's response in each scanning direction to the same stimulus region (also identified with a box). The RF estimated from the response to each scanning direction is shown in two orientations on therightside of each raster. Each RF is plotted as if viewing the skin through the back of the finger (i.e., from the neuron's point of view). RFs in the left column are plotted so the finger orientation in relation to the random-dot pattern (top panel) is the same as in the experiment; RFs in the right column are plotted so the finger points toward the top of the figure (see labels next to each RF; L indicates the left side of the finger when viewed through the dorsum of the finger with the tip pointing up). Each RF is represented by a 10 × 10 mm gray scale image in which bins that are darker than the gray background represent skin regions in which raised stimuli (dots) had an excitatory effect on the neuron's response; bins that are lighter than the gray background represent skin regions in which raised stimuli had an inhibitory effect on the neuron's response. The peak excitatory values in the four RFs are (top tobottom) 50, 39, 77, and 83 ips/mm. The corresponding peak inhibitory values are 31, 28, 53, and 67 ips/mm. Pattern motion in relation to the skin can be visualized by placing a fingerpad on the random-dot pattern in the orientation specified by the labels in theleftmost RF and scanning the finger fromleft to right across the pattern. For example, for the proximal-to-distal scanning direction (top spike raster), the finger should be placed on the stimulus pattern (top panel), pointed toward the left side of the page, and then scanned to the right side of the page.

