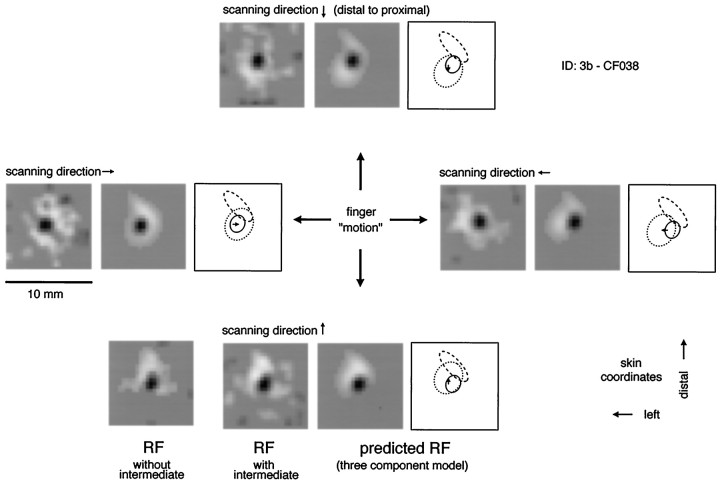
Fig. 7.
RF example in which the inhibitory areas are large in comparison with the excitatory area, which results in surround inhibition in some scanning directions. The observed (predicted) peak E/I ratios are (clockwise from proximal to distal) 1.3 (1.2), 1.5 (1.4), 1.6 (1.6), and 1.6 (1.6). Details as in Figure3.

