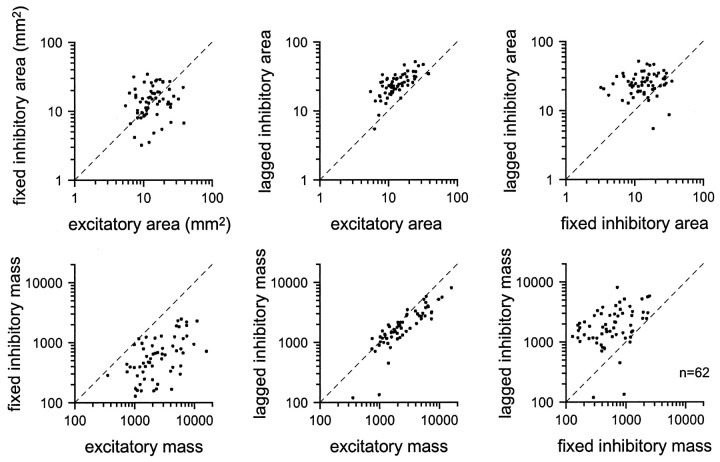
Fig. 9.
Areas (top row) and masses (bottom row) of the three RF response components computed from the three-component model. The area of each excitatory or inhibitory component was defined as the area within 2.15 SDs of its center. The mass of each component was defined as the sum of the absolute bin values within 2.15 SDs of its center.

