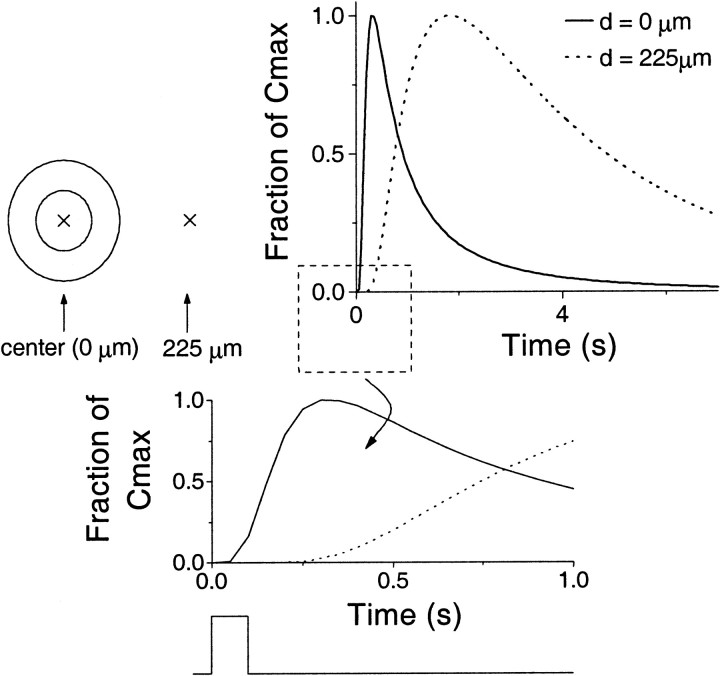
Fig. 2.
Concentration of NO plotted against time after synthesis for a hollow spherical source of inner radius 50 μm and outer radius 100 μm for a 100 msec burst of synthesis. Here thesolid line depicts the concentration at the center of the cell (0 μm), whereas the dotted line shows the concentration at 225 μm from the center. Because the absolute values attained at the two positions differ from one another markedly, the concentration is given as a fraction of the peak concentration attained. These peak values are 7.25 μm(center) and 0.25 μm at 225 μm. The cell and the points at which the concentration is measured are depicted to theleft of the main figure. Note the high central concentration, which persists for a long time (above 1 μmfor ∼2 sec). Also, there is a significant delay to a rise in concentration at distant points, which is more clearly illustrated in the expanded inset. The square wave shown beneath theinset represents the strength function.

