
Fig. 4.
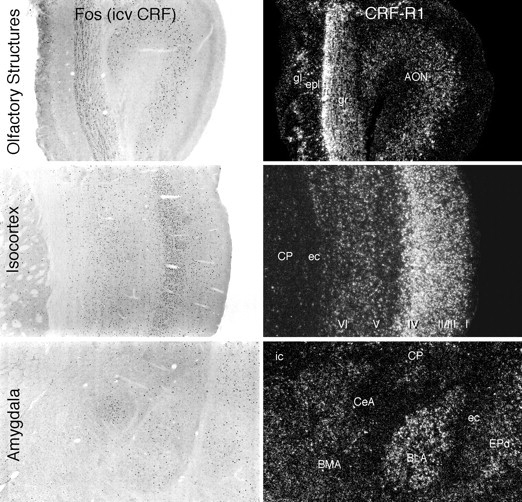
Relationship of forebrain sites of CRF-induced Fos-ir to loci of CRF-R1 mRNA expression. Patterns of Fos induction in various brain regions seen at 2 hr after icv injection of 1 μg CRF (bright-field photomicrographs, left) in relation to the distribution of CRF-R1 mRNA expression in the same regions (dark-field photomicrographs, right). At each level, the correspondence between the distribution of the two markers is striking and extends to the laminar and/or subnuclear levels. All major sites of Fos induction shown here express CRF-R1, except for the lateral part of the central nucleus of the amygdala (CeA), which expresses neither CRF receptor. I–VI, Isocortical layers; AON, anterior olfactory nucleus;BLA, basolateral nucleus of the amygdala;BMA, basomedial nucleus of the amygdala;CP, caudoputamen; ec, external capsule;epl, external plexiform layer (olfactory bulb);EPd, dorsal endopiriform nucleus; gl, glomerular layer (olfactory bulb); gr, granule cell layer (olfactory bulb); ic, internal capsule;m, mitral cell layer (olfactory bulb). All photomicrographs 30× magnification.