
Fig. 9.
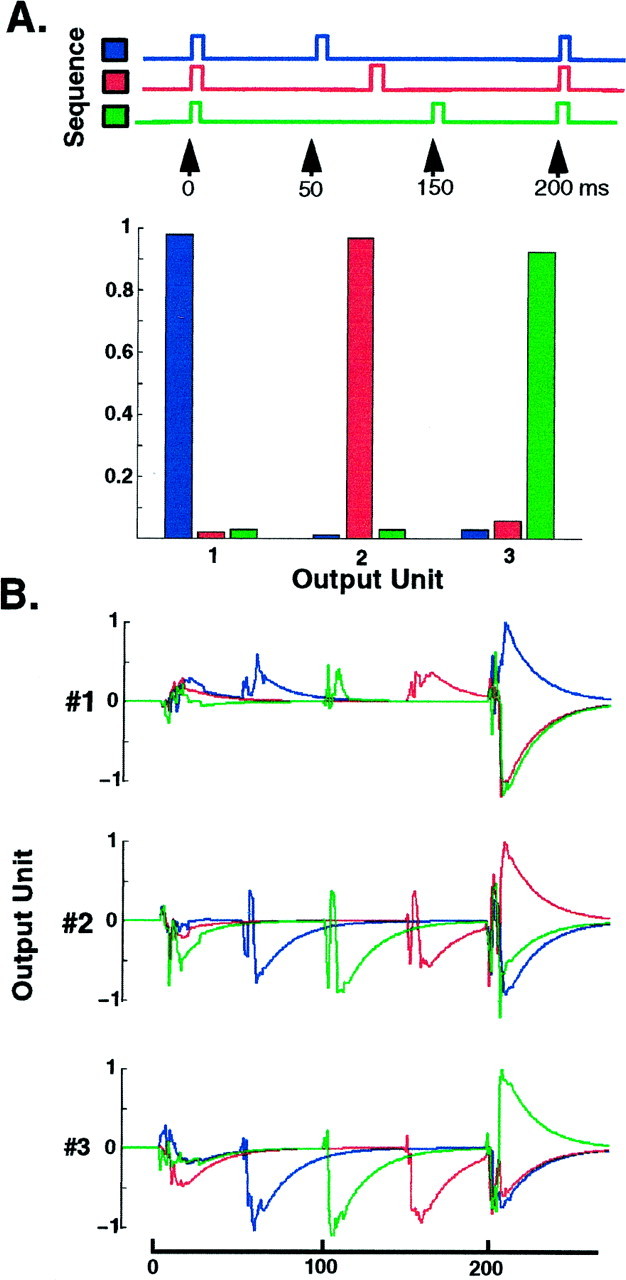
Discrimination of simple sequences.A, Average responses of the Output units trained on each stimulus to novel presentations of the three stimuli shown above.B, To understand how the output units perform sequence discrimination, we have plotted the activity of each output unit in response to each sequence. The activity plotted is simply the activity of all Ex units multiplied by the weight of the Ex → Ouput connection (and an RC time constant of 20 msec). Thus, the degree of the response to the different pulses reflects the overlap between the maximal response (last pulse of the target sequence). Distribution of the information content of all Ex units around the stimulus set.