
Fig. 2.
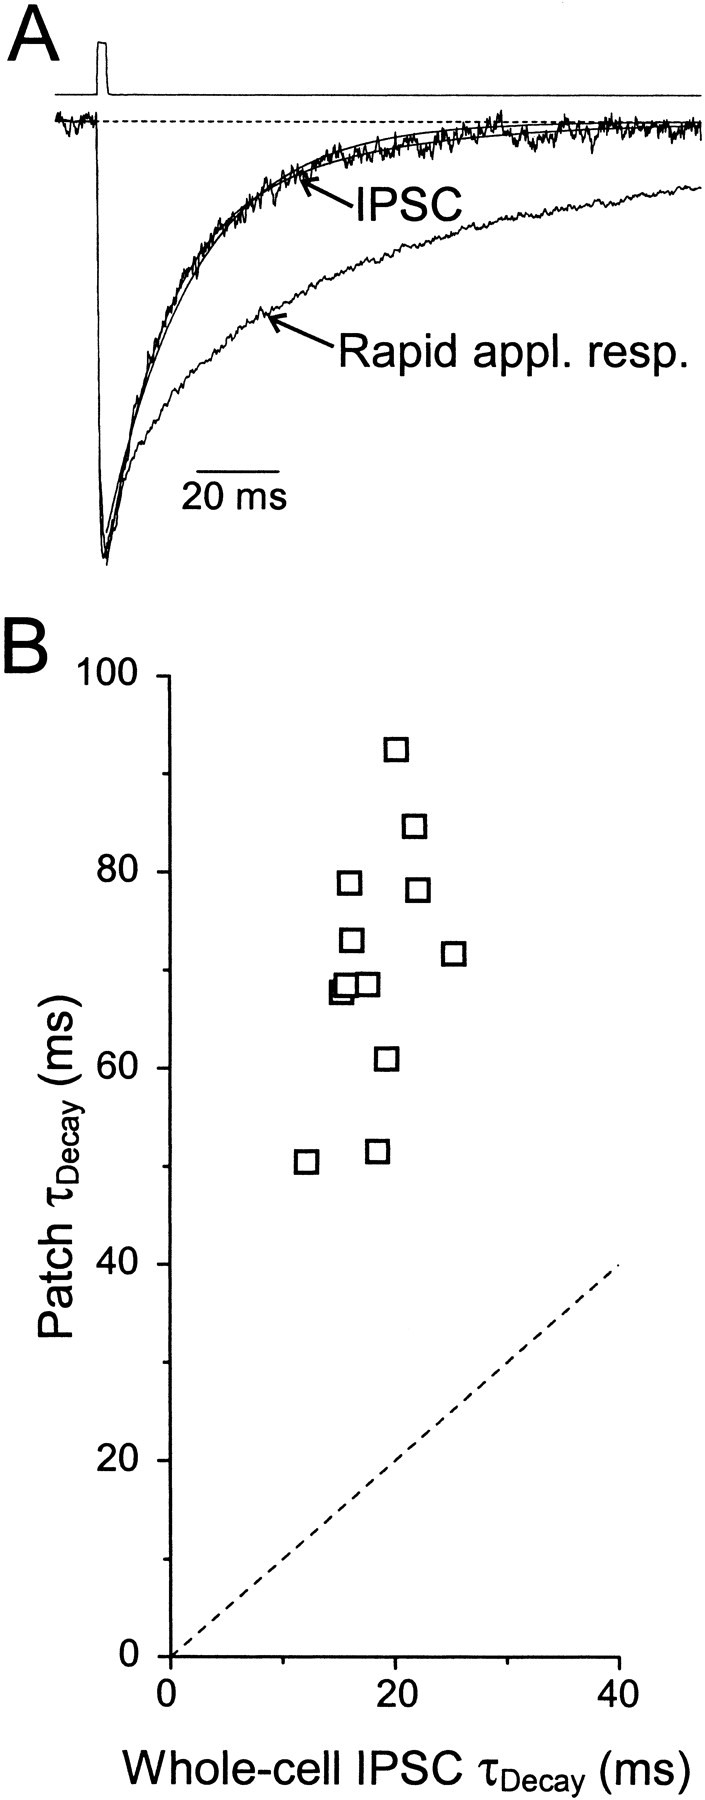
IPSCs and patch responses have different decay kinetics. A, Normalized average spontaneous IPSC and rapid application response to 1 mm GABA in an excised patch recorded from the same cell before and after patch excision. For the IPSC, biexponential fit parameters were τDec1,2 = 13.1 (68%) and 41.4 msec; monoexponential fit parameter was τDec = 22.0 msec. For the patch response, triexponential fit parameters were τDec1,2,3 = 11.6 (30%), 69.3 (55%), and 244 msec. Top trace shows the open-tip junction current recorded immediately after terminating the recording. B, Decay kinetics of rapid application responses plotted versus decay kinetics of IPSCs recorded in the same cells before patch formation. Dotted line has unity slope. In these 12 cells, fit parameters for the whole-cell IPSCs were τDec1,2 = 11.7 ± 1 (63 ± 1%) and 31.6 ± 2.6 msec. Fit parameters for the rapid application responses were τDec1,2,3 = 9.7 ± 1.6 (16 ± 3%), 54.9 ± 2.8 (63 ± 4%), and 168 ± 11 msec.