
Fig. 4.
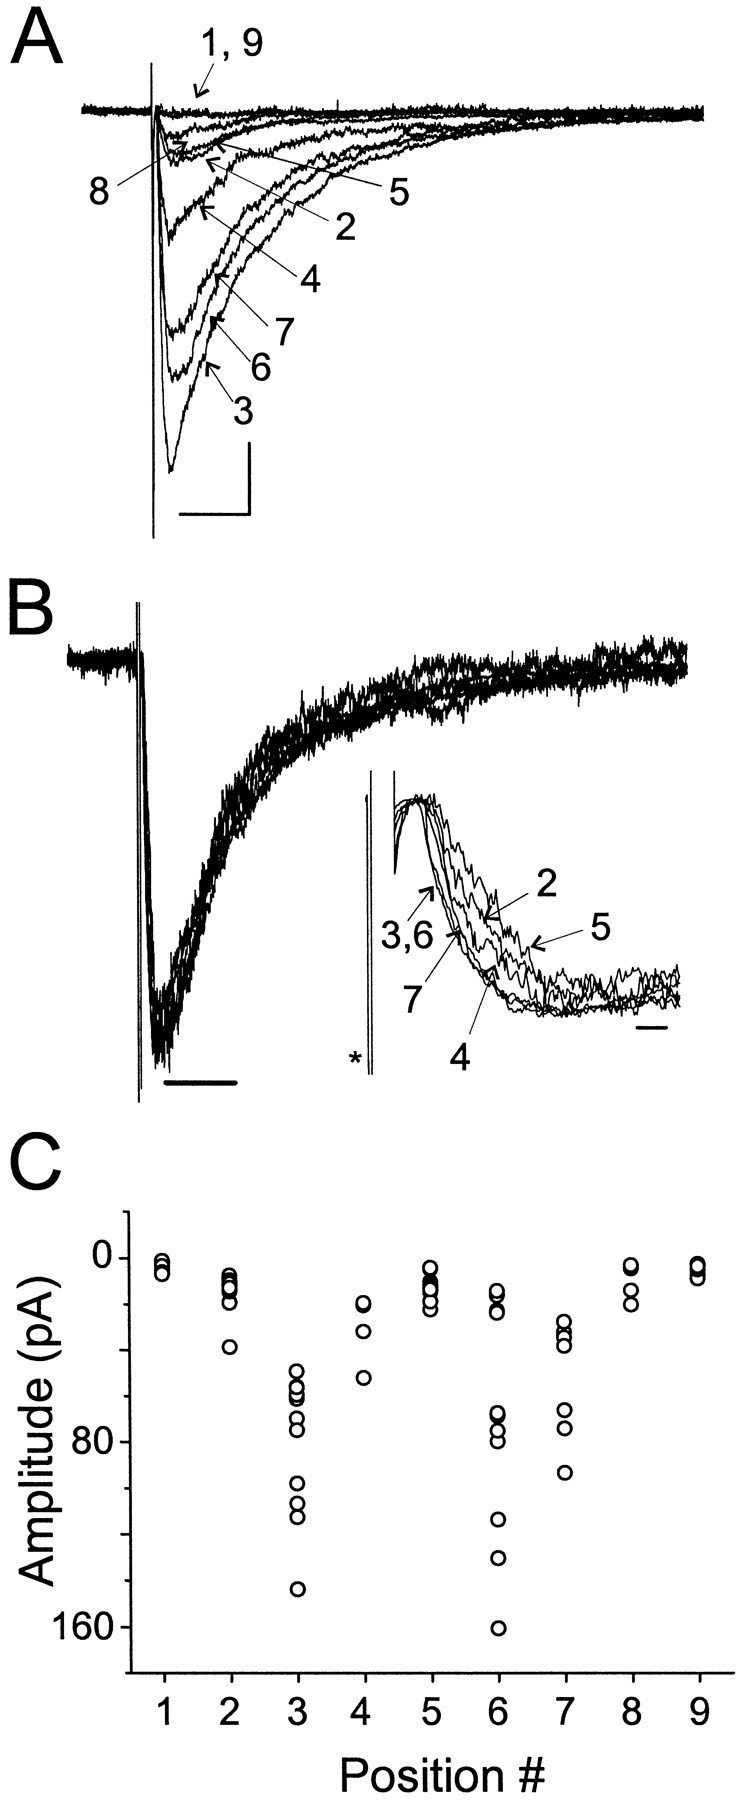
Responses of excised sniffer patches to synaptically released transmitter. A, Sniffer patch responses to stimuli in stratum pyramidale. Shown are the averaged responses at nine different positions, indicated bynumbers, above and in the slice. Positions 1 and 9 were above the slice. Positions 3 and 6 were the same location and yielded the largest amplitude responses. Position 2 was 10 μm from 3, whereas positions 4, 5, 7, and 8 were 3, 6, 10, and 20 μm from position 3, respectively, in the opposite direction as position 2. Calibration: 15 pA, 20 msec. B, Normalized data from A. Note that the decay kinetics exhibit little dependence on position. Calibration: 50 msec. Inset shows the normalized traces. Note the change in latency and rise time as position was changed.Asterisk marks the stimulus artifact. Trace from position 8 had a high noise level and is not shown. Calibration: 2 msec. C, Peak amplitude as a function of position for individual responses from the positions shown in A andB. Note that although the response amplitudes were variable, there were abrupt changes in the amplitude range as a function of position.